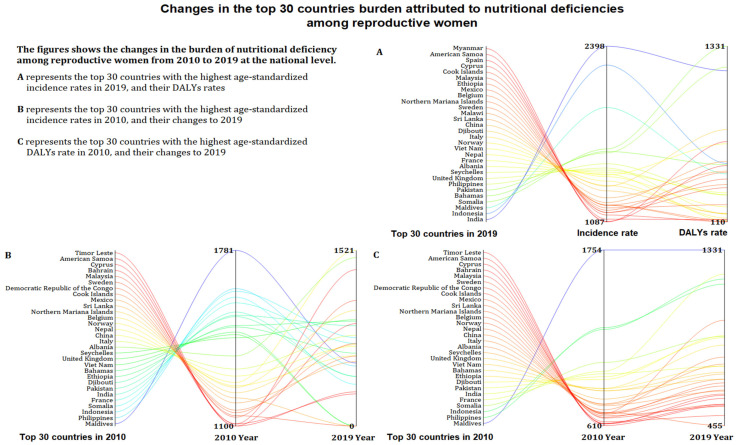
Figure 5.
The age-standardized incidence rate and age-standardized DALYs rate (per 100,000) in 2019, and their change from 2010 to 2019 in the top 30 countries attributed to nutritional deficiencies among reproductive women. DALYs = disability-adjusted life years. (A) Top 30 countries with the highest age-standardized incidence rates and their age-standardized DALYs rate in 2019. (B) The top 30 countries with the highest age-standardized incidence rates in 2010, and their age-standardized incidence rates in 2019. (C) The top 30 countries with the highest age-standardized DALYs rates in 2010, and their age-standardized DALYs rates in 2019.

