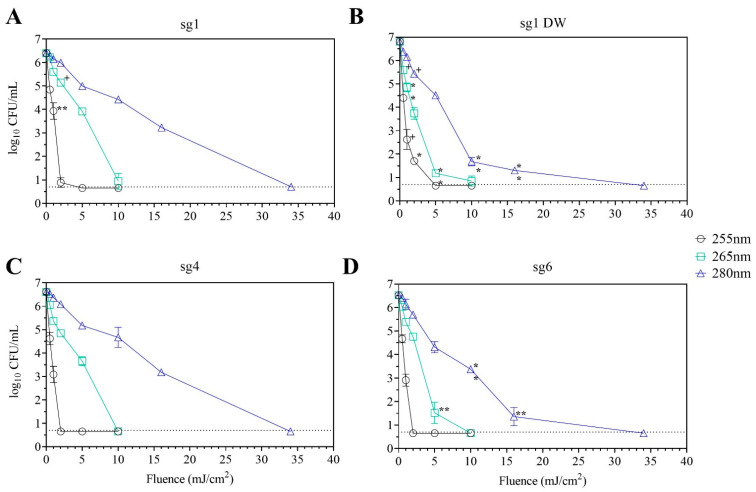
Figure 2.
Inactivation of Lp strains using the UV-C LED collimated beam. Lp sg 1 (A), sg 1 DW isolate (B), sg 4 (C), and sg 6 (D) were exposed to various UV fluences at 255 nm (black open circles), 265 nm (green squares), and 280 (blue triangles) as described in Materials and Methods. Data (mean ± standard deviation) are representative of three replicates for each strain. The limit of detection of 0.7 log10 CFU/mL is indicated by the dotted line. Statistical significance when compared to all other strains are denoted as + for p < 0.05, * for p < 0.01, and ** for p < 0.001. See also Supplemental Materials Table S1.

