Figure 3.
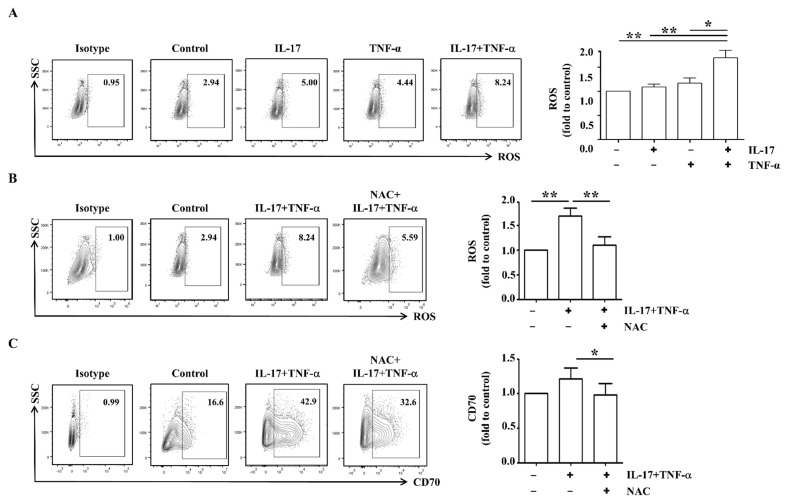
IL-17 and TNF-α enhance ROS expression in RA FLS. (A) RA FLS (n = 8) were cultured with or without IL-17 (5 ng/mL) and TNF-α (5 ng/mL) for 24 h. To analyze ROS expression, flow cytometry analysis was performed using DCFDA. Data from one representative experiment are presented (left). Average ROS expression was displayed as fold change of the MFI compared to control (right). (B) RA FLS (n = 8) were pre-incubated with 10 nM of NAC for 1 h, and then, cells were stimulated with or without IL-17 (5 ng/mL) and TNF-α (5 ng/mL) for 24 h. To analyze ROS expression, flow cytometry analysis was performed using DCFDA. Data from one representative experiment are presented (left). Average ROS expression is displayed as fold change of the MFI compared to control (right). (C) RA FLS (n = 5) were pre-incubated with 10 nM of NAC for 1 h, and then, cells were stimulated with or without IL-17 (5 ng/mL) and TNF-α (5 ng/mL) for 24 h. To analyze the surface expressions of CD70, flow cytometry analysis was performed using PE-conjugated anti-CD70. Data from one representative experiment are presented (left). Average CD70 expression was calculated as fold change of the MFI compared to control (right). Statistical analysis was performed using a Mann–Whitney test. * indicates p < 0.05; ** indicates p < 0.01.

