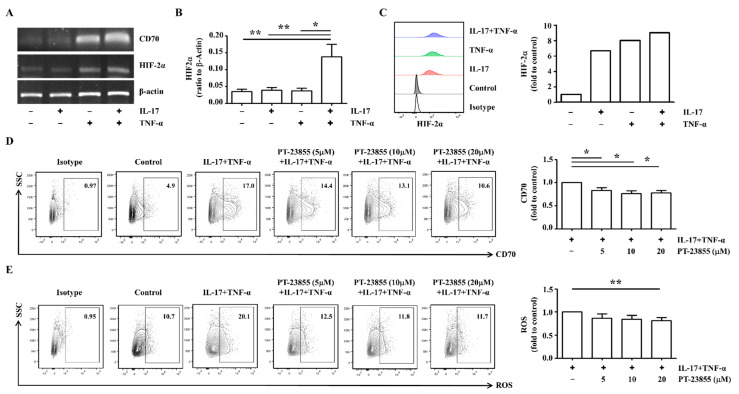
Figure 4.
CD70 expression in RA FLS is downregulated by HIF-2α-specific inhibition. (A) RA FLS were cultured with or without IL-17 (5 ng/mL) and TNF-α (5 ng/mL) for 24 h. (B) RA FLS (n = 6) were cultured with or without IL-17 (5 ng/mL) and TNF-α (5 ng/mL) for 24 h. mRNA levels of CD70 or HIF-2α were assessed by RT-PCR, using β-actin as the housekeeping gene. Statistical differences were determined using one-way ANOVA. (C) To analyze the intracellular expressions of HIF-2α, RA FLS were cultured with or without IL-17 (5 ng/mL) and TNF-α (5 ng/mL) for 24 h. Following fixation and permeabilization, RA FLS were stained using rabbit anti-human HIF-2α with FITC-conjugated anti-rabbit IgG secondary antibody. Data from one representative experiment are presented (left). The averages of HIF-2α expression are displayed as fold change of the MFI compared to control (right). (D) RA FLS (n = 4) were cultured with or without IL-17 (5 ng/mL) and TNF-α (5 ng/mL) for 24 h. To inhibit HIF-2α, cells were co-treated with 5, 10, or 20 μM of PT-2385 for 24 h. To analyze surface expression of CD70, flow cytometry analysis was performed using PE-conjugated anti-CD70. Data from one representative experiment are presented (left). The averages of CD70 expression are displayed as fold change of the MFI compared to cytokine-stimulated cells (right). Statistical analysis was performed using a Mann–Whitney test. (E) RA FLS (n = 5) were cultured with or without IL-17 (5 ng/mL) and TNF-α (5 ng/mL) for 24 h. To inhibit HIF-2α, cells were co-treated with 5, 10, and 20 μM of PT-2385 for 24 h. To analyze ROS levels, flow cytometry was performed using DCFDA. Data from one representative experiment are presented (left). Average ROS levels are displayed as fold change of the MFI compared to cytokine-stimulated cells (right). Statistical analysis was performed using a Mann–Whitney test. The bar represents the mean. * indicates p < 0.05; ** indicates p < 0.01.

