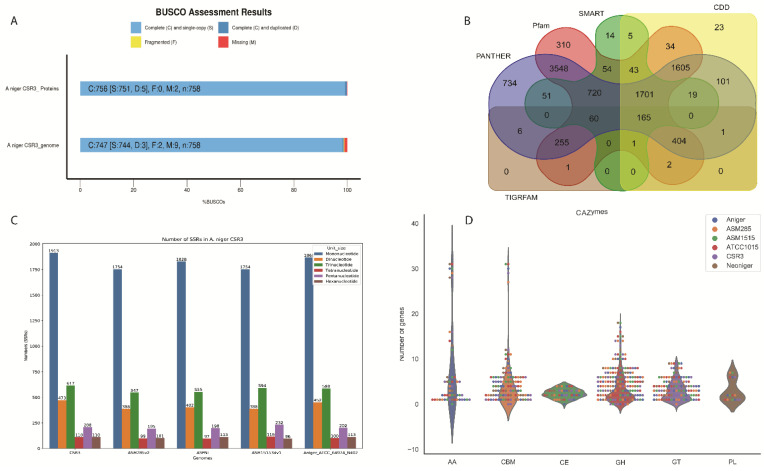
Figure 2.
(A) BUSCO plots for the A. niger CSR3 genome and proteomes. The plot shows quantitative measures for the assessment of genome completeness based on evolutionarily informed expectations of gene content from near-universal single copy orthologs selected from the “fungi_odb10*” database. (B) Venn diagram shows shared and unique genes between five databases. (C) Analysis of simple sequence repeats (SSR) in the genomes from five A. niger strains. (D) Comparison of CAZymes among genomes from five A. niger strains. The x-axis shows different CAZymes classes.

