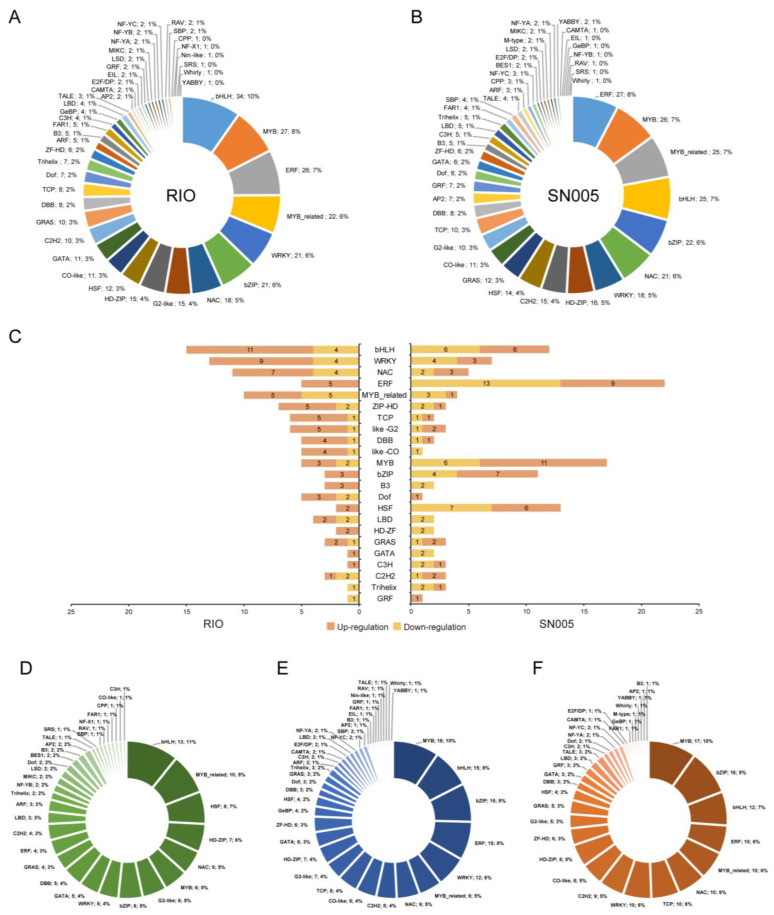
Figure 5.
Families of differentially expressed transcription factors in the two genotypes. Distribution in families of differentially expressed transcription factors in the tolerant line RIO (A) and the sensitive line SN005 (B) at all time points. (C) Distribution of up- and downregulated transcription factors in the two genotypes at the early stage (1 and 2 h). Distribution of families of transcription factors in common response gene sets (D), RIO-specific response gene sets (E), and SN005-specific response gene sets (F). Pie charts show the percentage of genes in each transcription factor family.

