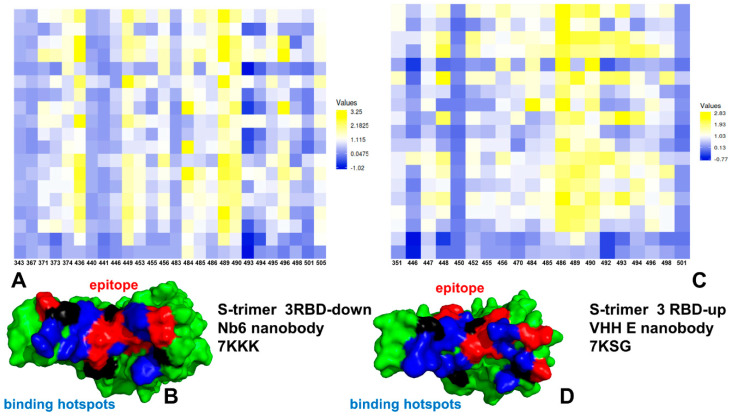
Figure 5.
The mutational scanning heatmap for the SARS-CoV-2 S trimer complex with Nb6 nanobody, pdb id 7KKK (A,B) and VHH E nanobody, pdb id 7KSG (C,D). The binding energy hotspots correspond to residues with high mutational sensitivity. The heatmaps show the computed binding free energy changes for all single mutations on the binding epitope sites. The squares on the heatmap are colored using a 3-colored scale—from blue to yellow, with yellow indicating the largest destabilization effect. (B,D) Structural map of the binding epitopes and binding energy hotspots for Nb6 and VHH E. The S-RBD is shown in green surface. The epitope residues are shown in red and the binding energy hotspots are shown in blue surface. The computed standard errors of the mean for the binding free energy changes are based on selected samples from atomistic trajectory reconstructed from CG-CABS simulations (~1000 samples) and are within 0.0.7–0.16 kcal/mol.

