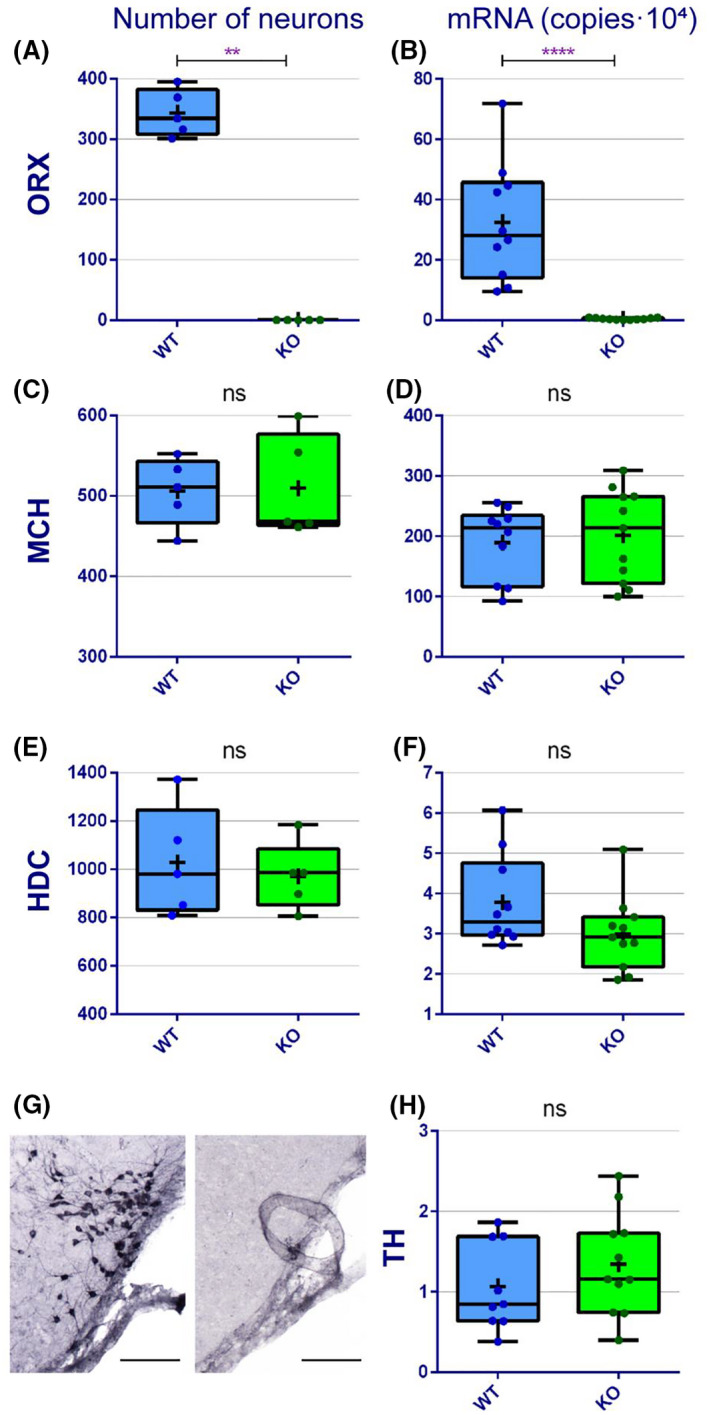
FIGURE 1.

Evaluation of ORX, MCH, HDC, and TH content in a genetic model of NT1, the Orex‐KO mice. Number of ORX (A), MCH (C), and HDC (E) neurons in C57BL/6J WT and Orex‐KO mice. mRNA expression level for ORX (B), MCH (D), HDC (F), and TH (H) in C57BL/6J WT and Orex‐KO mice. Data are shown as median (Q1–Q3), individual data values are represented as dots and the mean is represented as a cross. Mann–Whitney U test, *p < 0.05; **p < 0.01. ns, not significant. (G) Microphotograph illustrating HDC immunostaining in the tuberomammillary nucleus of a WT (left) and a HDC‐KO mouse (right). Scale bars: 110 µm
