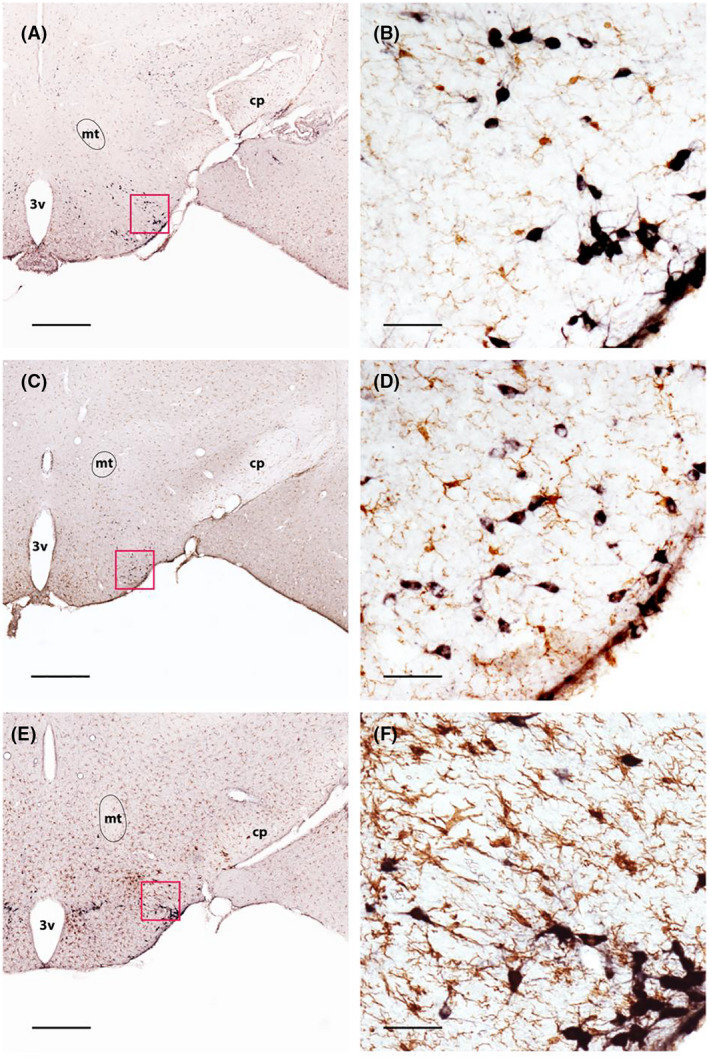
FIGURE 2.

Evaluation of microglial activation in Orex‐KO and Orex‐HA mice. Double immunostaining of HDC (black) and Iba1 (brown) in the hypothalamus of WT (A and B), Orex‐KO (C and D), and Orex‐HA mice transferred twice with autoreactive CD8+ T cells at 60 days post‐injection (E and F). Red squares in A, C, E illustrate the enlarged areas shown in B, D, and F, respectively. Scale bars: 560µm (A, C, and E) or 50µm (B, D, and F). 3v, third ventricle; cp, cerebral peduncle; mt, mammillothalamic tract
