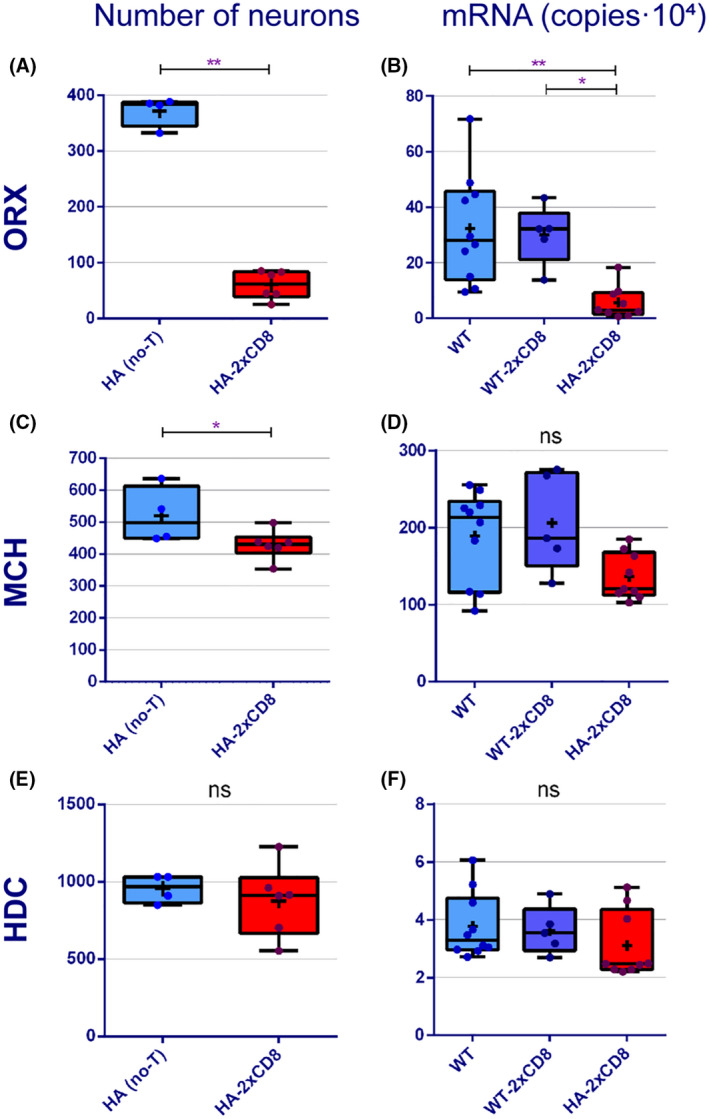
FIGURE 3.

Evaluation of ORX, MCH and HDC content in the immune‐mediated model of narcolepsy. Number of ORX (A), MCH (C), and HDC (E) neurons in WT and in Orex‐HA mice 60 days after T cell transfer. mRNA expression level for ORX (B), MCH (D), and HDC (F) in WT and in Orex‐HA mice 60 days after T cell transfer. Data are shown as median (Q1–Q3), individual data values are represented as dots and the mean is represented as a cross. Mann–Whitney (two groups) or Kruskal–Wallis (three groups) tests, *p < 0.05; **p < 0.01. ns, not significant
