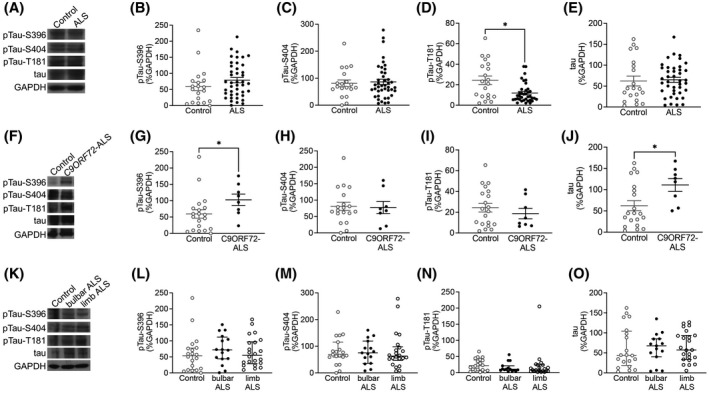
FIGURE 5.

While pTau‐T181 levels are decreased in ALS motor cortex, pTau‐S396 and total tau levels are increased only in C9ORF72‐ALS. (A) Representative western blot images of pTau‐S396, pTau‐S404, pTau‐T181, total tau and GAPDH in control and ALS mCTX. There were no significant change in the levels of (B) pTau‐S396 (Mann–Whitney U test = 317, p = 0.1234) and (C) pTau‐S404 (Mann–Whitney U test = 396, p = 0.9665) between ALS (n = 43) and controls (n = 21). (D) pTau‐T181 levels were significantly decreased in ALS mCTX (n = 43) compared with controls (n = 21) (Mann–Whitney U test = 226.5, p = 0.0157). (E) There was no significant change in total tau levels between ALS (n = 43) and control mCTX (n = 21) (Mann–Whitney U test = 366, p = 0.5071). (F) Representative western blot images of pTau‐S396, pTau‐S404, pTau‐T181, total tau and GAPDH in control, and C9ORF72‐ALS mCTX. (G) There was a significant increase in pTau‐S396 levels in C9ORF72‐ALS (n = 8) compared with control mCTX (n = 21) (Mann–Whitney U test = 36, p = 0.0247). There were no significant changes in (H) pTau‐S404 (Mann–Whitney U test = 76, p > 0.999) and (I) pTau‐T181 levels (Mann–Whitney U test = 66, p = 0.5002) in C9ORF72‐ALS (n = 8) compared with control mCTX (n = 21). (J) There was a significant increase in total tau levels in C9ORF72‐ALS (n = 8) compared with controls (n = 21) (Mann–Whitney U test = 61, p = 0.0211). (K) Representative western blot images of pTau‐S396, pTau‐S404, pTau‐T181, total tau, and GAPDH in mCTX from control, bulbar, and limb onset ALS. There were no significant alterations in the levels of (L) pTau‐S396 (one‐way ANOVA [F(2,55) = 0.3652, p = 0.6958], (M) pTau‐S404 (one‐way ANOVA [F(2,53) = 0.02583, p = 0.9745], (N) pTau‐T181 (one‐way ANOVA [F(2,53) = 0.2965, p = 0.7447], and (O) total tau (one‐way ANOVA [F(2,55) = 0.04461, p = 0.9564] between controls (n = 21), bulbar onset ALS (n = 16), or limb onset ALS (n = 23). *p < 0.05
