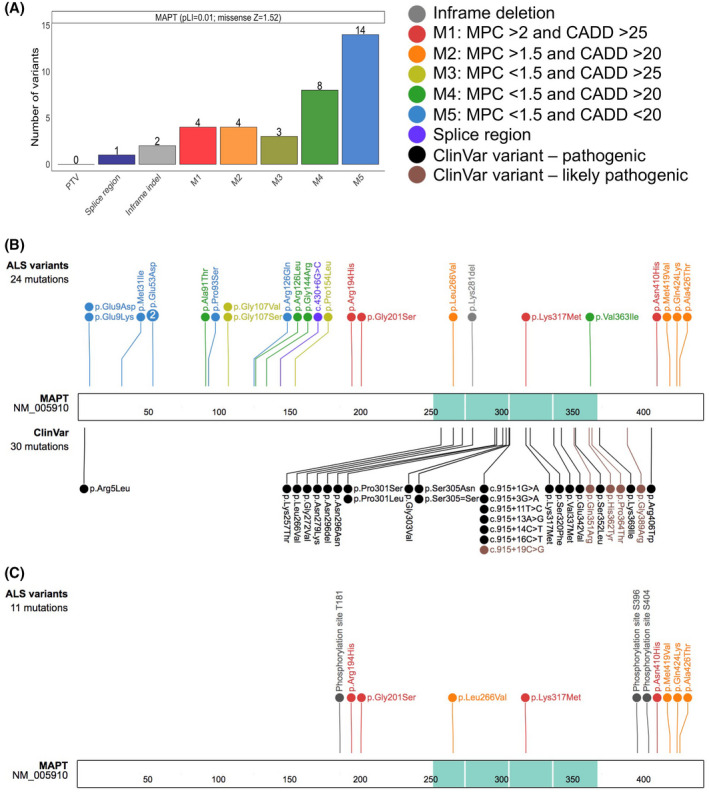
FIGURE 6.

Protein schematic of MAPT variants observed in ALS. (A) Variant types are displayed on the X‐axis with their respective counts on the Y‐axis for the MAPT gene. The colors represent the type of non‐synonymous changes observed, and the number next to the variants, noted on top of each bar, depicts the number of individuals observed to carry the corresponding variant. The probability of loss of function (pLI) and the missense constraint Z scores for MAPT are shown adjacent to the gene label. PTV, protein truncating variant; indel, insertion/deletion; M in M1‐M5, missense. Missense variants were divided into five classes depending on their MPC (Missense badness, PolyPhen‐2, and Constraint) and CADD (Combined Annotation Dependent Depletion) deleteriousness scores. (B) Schematic representation highlighting the novel ALS MAPT variants displayed on top. Variants identified only in ALS cases were classified as “ALS unique variants,” while the variants observed in ALS cases and also at a very low allele frequency in gnomAD were classified as “ALS rare variants.” The variants displayed on the bottom were ClinVar pathogenic (black) and likely pathogenic (brown) variants. The microtubule‐binding domain is shown in turquoise. The numbers within the protein sequence depicts the amino acid position. (C) Schematic representation of the newly identified pathogenic or likely pathogenic MAPT variants in ALS together with the known phosphorylation sites at T181, S396 and S404 across tau protein
