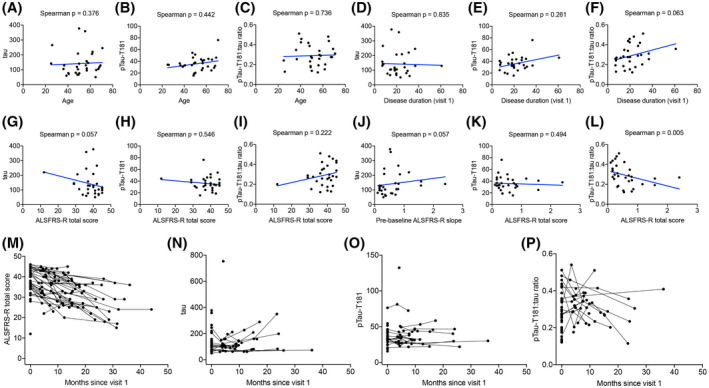
FIGURE 8.

CSF pTau‐T181:tau ratio correlates with ALS duration and progression. There was no correlation between CSF (A) tau (Spearman correlation, p = 0.376), (B) pTau‐T181 (Spearman correlation, p = 0.442), or (C) pTau‐T181:tau ratio (Spearman correlation, p = 0.736) and the age at first visit. (D) CSF tau (Spearman correlation, p = 0.835) and (E) pTau‐T181 levels (Spearman test, p = 0.261) did not correlate with ALS disease duration. (F) There was a trend toward a significant correlation between CSF pTau‐T181:tau ratio and ALS disease duration (Spearman correlation, p = 0.063). (G) There was a trend toward a significant inverse correlation between CSF tau and ALSFRS‐R (Spearman correlation, p = 0.057). (H) There was no correlation between CSF pTau‐T181 and ALSFRS‐R (Spearman correlation, p = 0.546). (I) There was no correlation with CSF pTau‐T181:tau ratio and ALSFRS‐R (Spearman correlation, p = 0.222). (J) There was a trend toward a negative correlation between CSF tau and ALSFRS‐R slope (Spearman correlation, p = 0.057). (K) There was no correlation between CSF pTau‐T181 and ALSFRS‐R slope (Spearman correlation, p = 0.494). (L) There was a positive correlation between CSF pTau‐T181:tau ratio and ALSFRS‐R slope (Spearman correlation, p = 0.005). (M) There was a significant decline in ALSFRS‐R over time (p < 0.001). There was no significant alterations in CSF (N) tau (p = 0.907), (O) pTau‐T181 (p = 0.222), and (P) pTau‐T181:tau ratio (p = 0.578)
