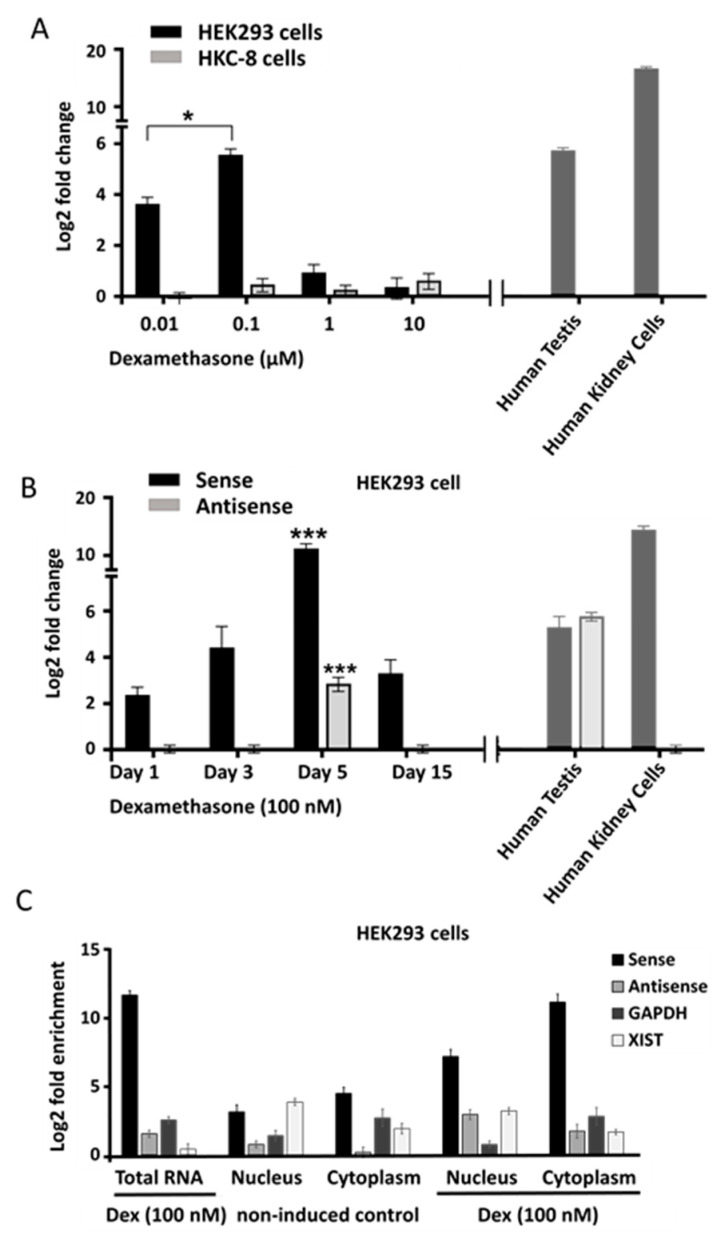
Figure 3.
Expression of sense and antisense transcripts in response to dexamethasone in HEK293 and HKC-8 cells. (A) Response of the sense transcript to increasing levels of dexamethasone in HEK293 cells (black) and HKC-8 cells (grey) measured by RT-qPCR. Human testis RNA and human kidney cell RNA were used as positive controls (right panel). (B) Time dependence of the dexamethasone response of sense (black) and antisense (grey) transcripts in HEK293 cells. Control RNAs from testis and kidney on the right. (C) Nuclear and cytoplasmic distribution of sense and antisense transcripts in HEK293 cells. Nuclear and cytoplasmic fractions were enriched followed by RNA extraction and RT-qPCR from control and dexamethasone induced cells (underscored). XIST was measured to estimate nuclear enrichment, GAPDH for cytoplasmic enrichment. One-way ANOVA followed by Tukey’s test for multiple comparisons, * p < 0.05; *** p < 0.001.

