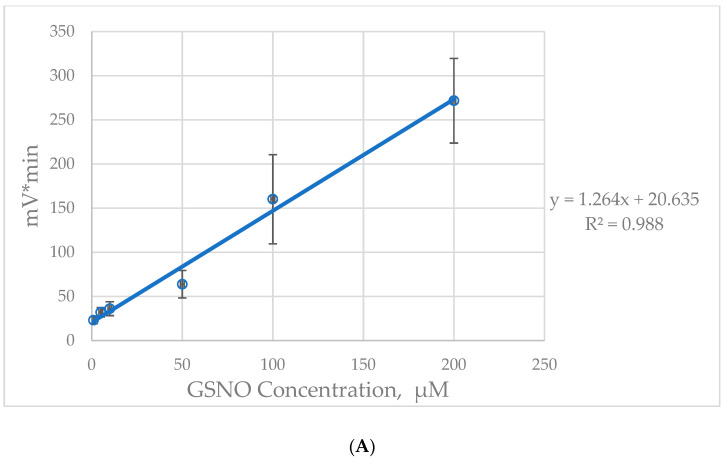
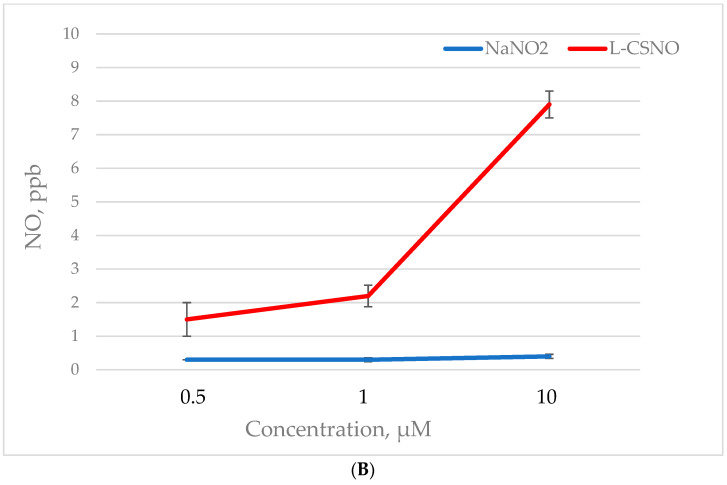
Figure 2.
Chemiluminescence signal using the photolysis device in vitro. (A) GSNO standard curve. Plotting the averaged NO values against the initial GSNO concentrations in vitro yielded a strong linear relationship. The associated equation was used to correlate NO release with known concentrations and eventually to estimate the concentration in biological samples. “y” is NO released, and “x” is the initial SNO concentration: y = 1.264x + 20.635. (B) Comparison of chemiluminescent signal of L-CSNO and NaNO2. We measured NO release from NaNO2 and L-CSNO dissolved in PBS. NO evolved from increasing concentrations of NaNO2 was between 0.3 and 0.4 ppb, which is equal to ambient air (N = 3), while L-CSNO gave proportional increase in NO signaling (from 1.5 to 7.9 ppb) with its increased concentration (ANOVA, N = 3, each, p ≤ 0.0001).


