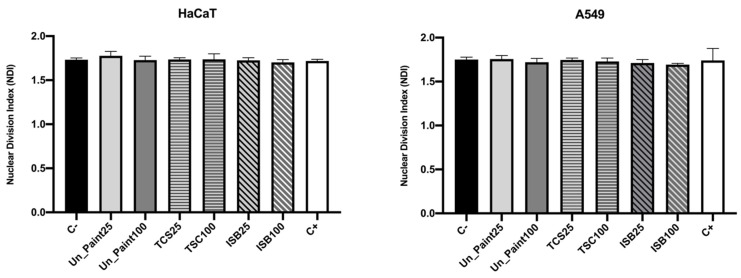
Figure 7.
Nuclear division index (NDI) of HaCaT (left) and A549 (right) cell lines, after exposure to extracts of the samples (in the x axis) Un_Paint, TCS or ISB extracts for 24 h. C- negative control (complete medium), C+ positive control (MMS 800 µM solution). The values are expressed as mean ± standard deviation. The statistical significance of samples compared to C- was analyzed by One-way ANOVA; p < 0.05. The statistical significance of samples compared to Un_Paint was analyzed by Two-way ANOVA; p < 0.05. The statistical significance of the extract on A549 cells compared to the same extract, in the same concentration, on HaCaT cells was analyzed by Two-way ANOVA; p < 0.05.

