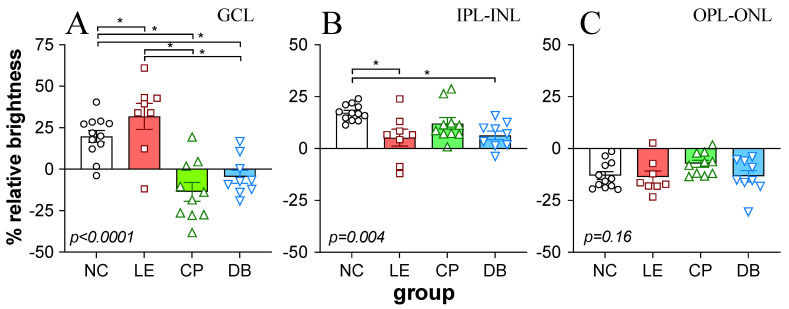
Figure 5.
Effect of blue light exposure and blue light-blocking lenses on retinal caspase immunofluorescence. Bar plots showing signal intensity relative to total retinal intensity (%) for the ganglion cell layer ((A): GCL), combined inner plexiform and inner nuclear layer ((B): IPL-INL), and the combined outer plexiform and outer nuclear layer ((C): OPL-ONL). Individual values are shown. Error bars show the standard error of the mean. p-values in each panel indicate the significance of one-way ANOVA comparison between groups. * Indicates significant (p < 0.05) post hoc difference between pairs.

