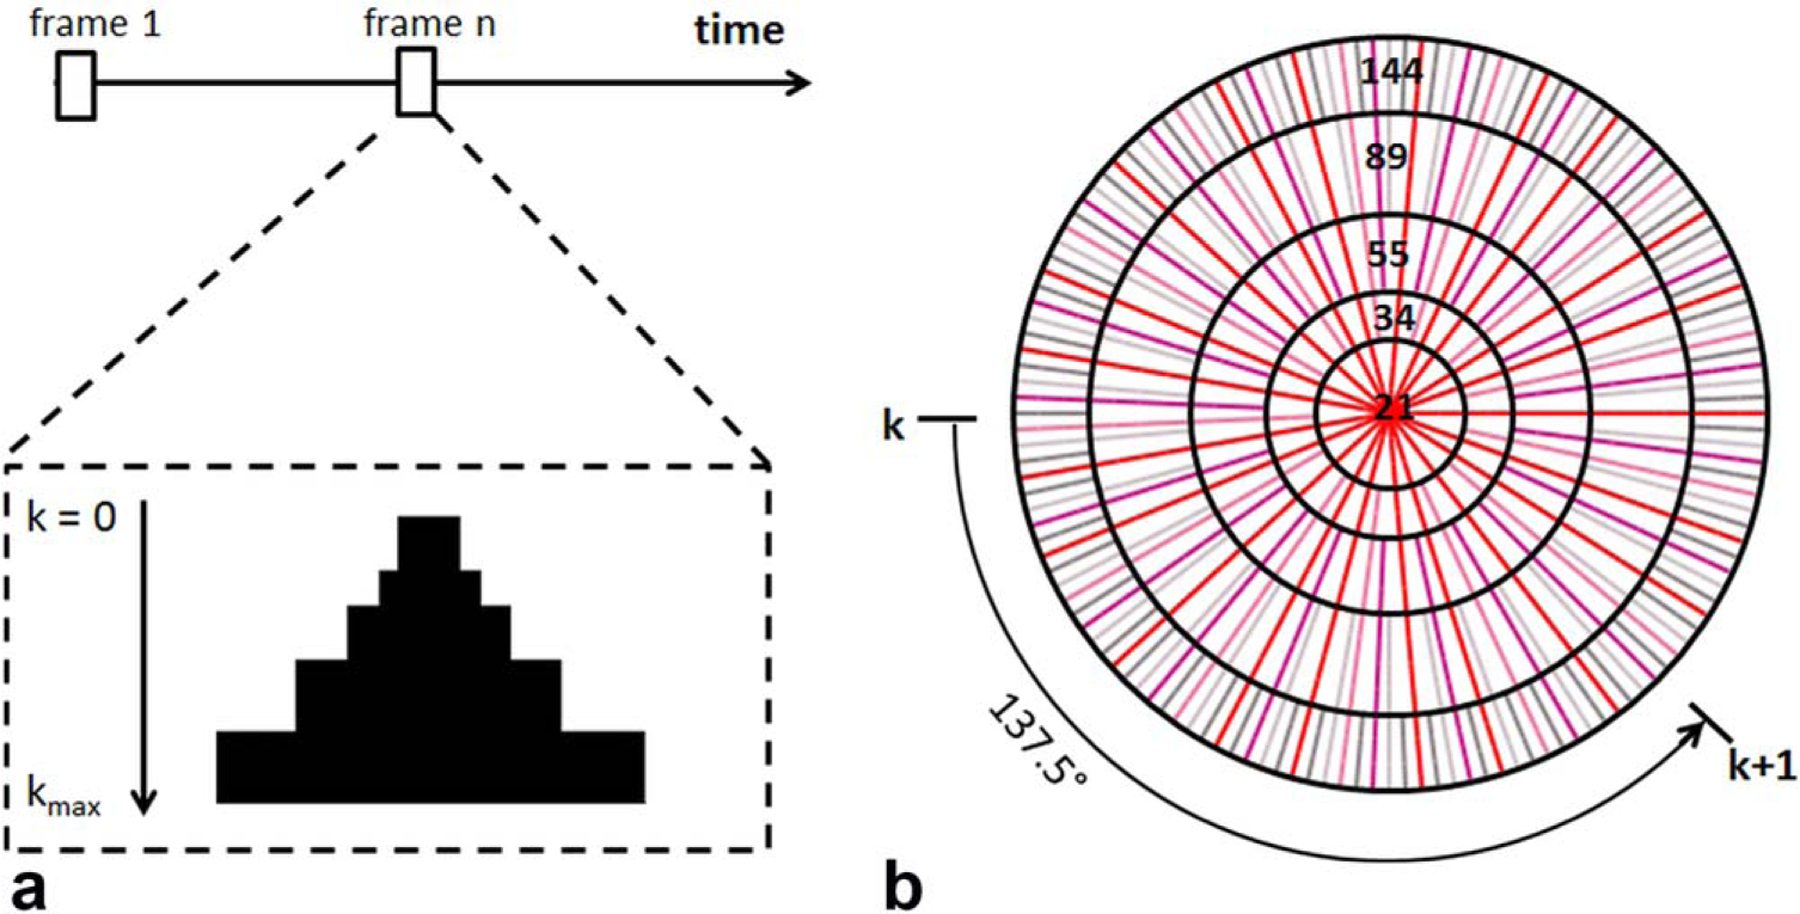
FIG. 1.

Image reconstruction by k-space filtering. a: Data selection for a specific time frame. Half of the k-space from center to kmax is shown. The k-space filter was shifted by 21 spokes from one time frame to the next. b: k-space filtering with golden-ratio–based profile order. The k-space was segmented into 5 rings with 21 spokes in the central ring. The following rings consisted of 34, 55, 89, and 144 spokes, respectively.
