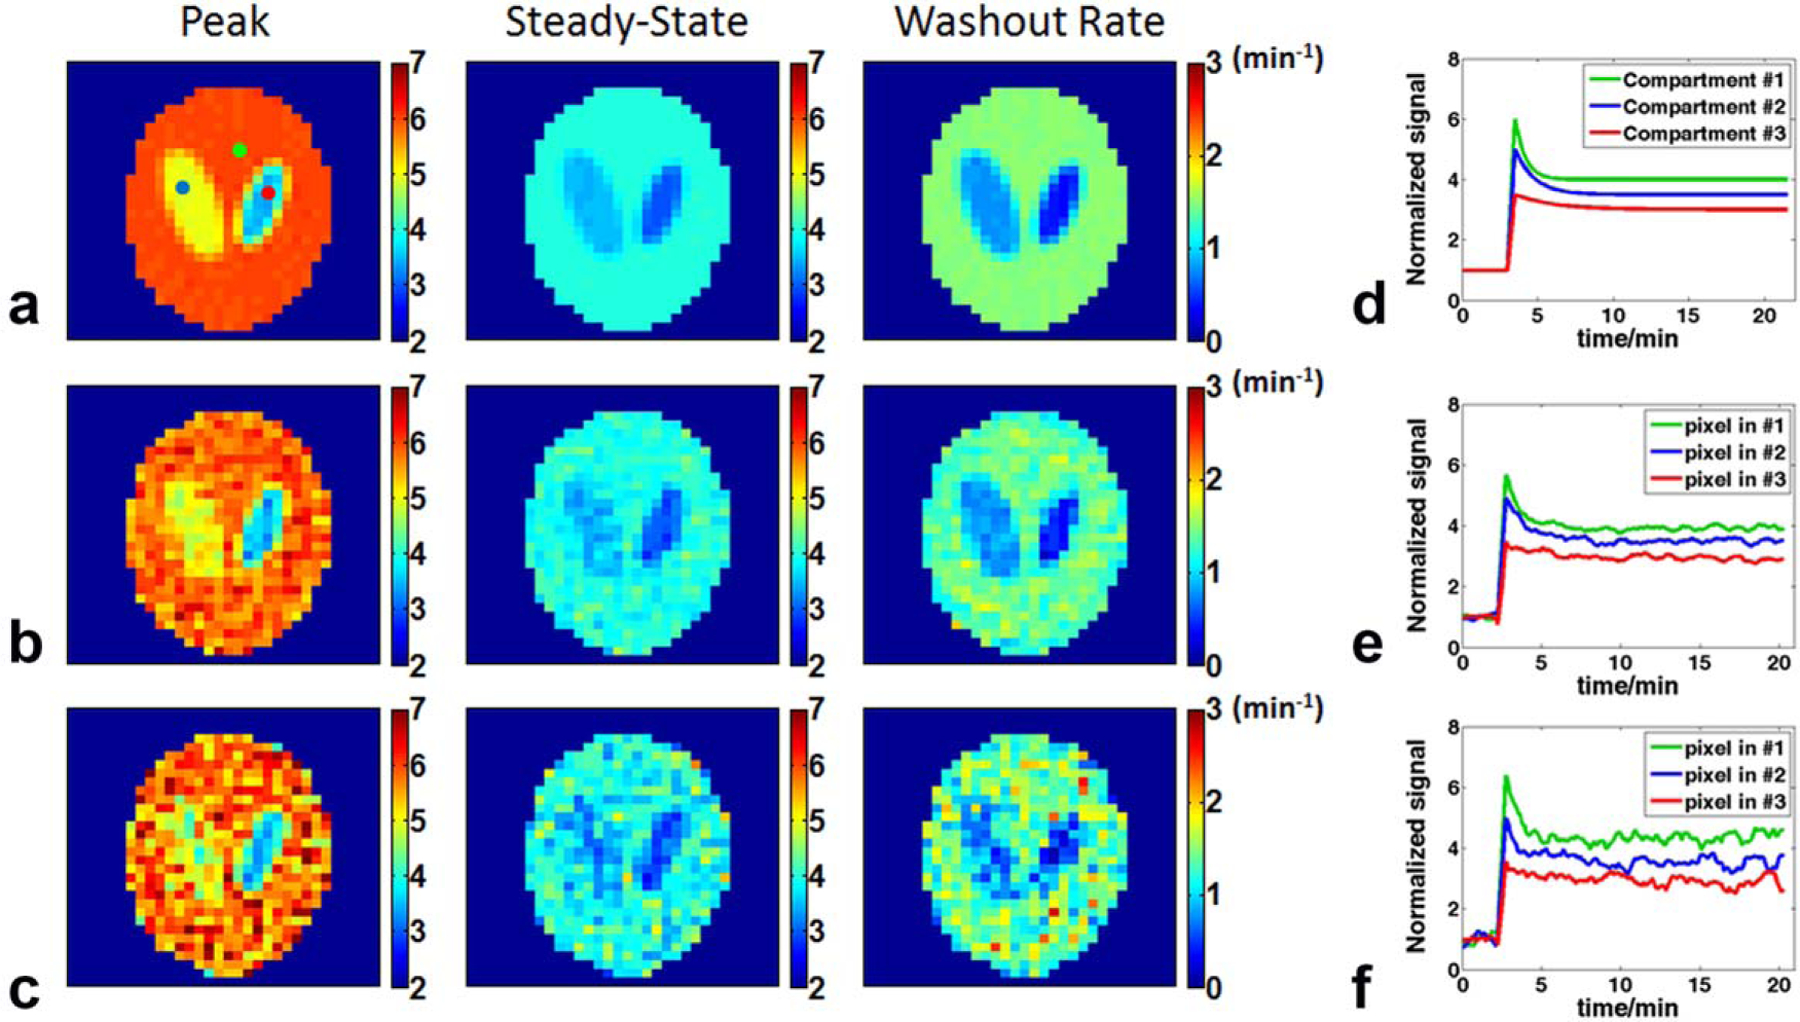
FIG. 2.

Simulation results at two different noise levels. a: Maps of peak and steady-state uptake and washout rate generated from noiseless data. b: Data with a baseline SNR of 20. c: Data with a baseline SNR of 10. d: Simulated, noise-free time courses of the signal changes in the three compartments. e, f: Time courses of the representative pixels in each of the three compartments with a baseline SNR of 20 (e) and 10 (f). The selected pixels are indicated by colored dots in (a). SNR = signal-to-noise ratio.
