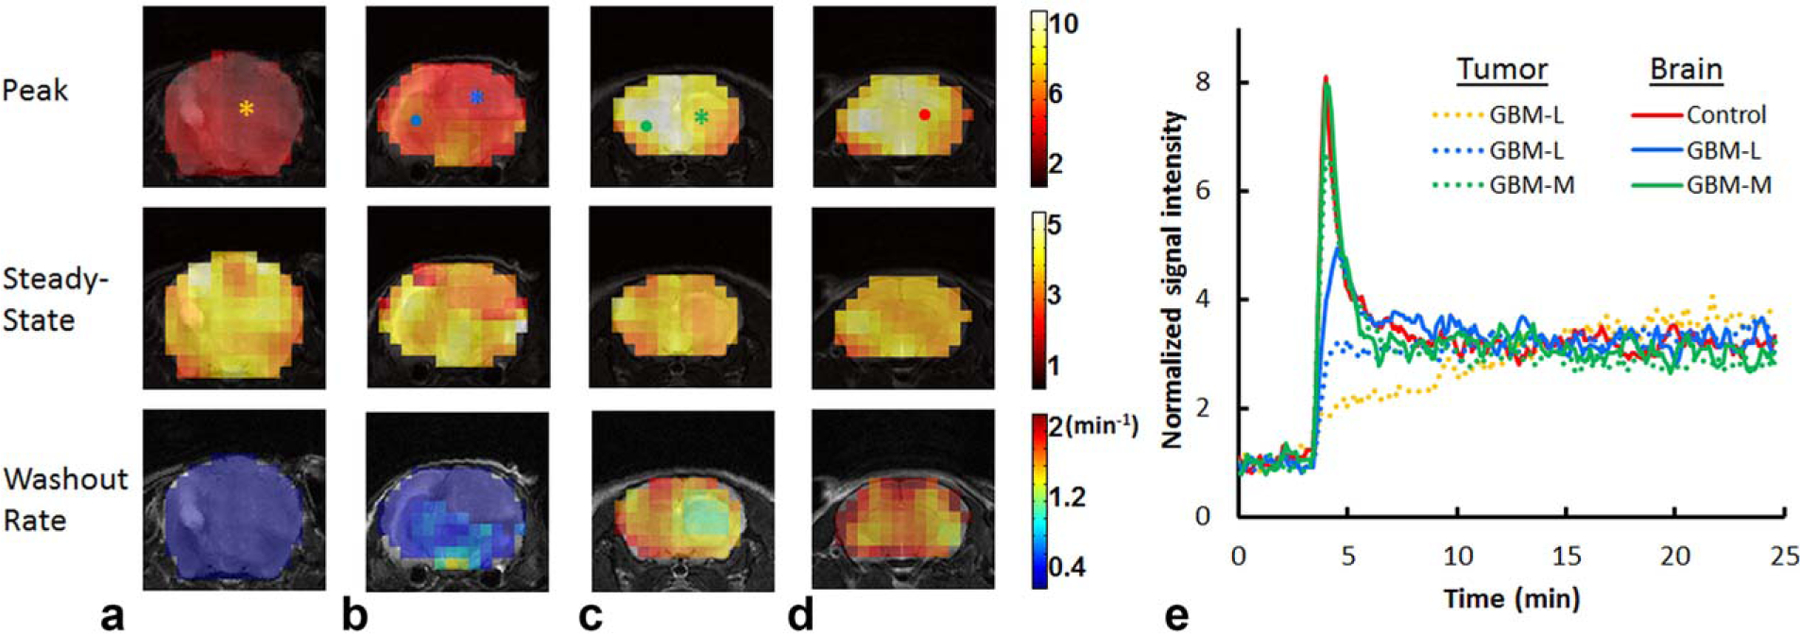
FIG. 6.

Reconstructed parameter maps and representative time courses. a, b: glioblastoma-large mice. c: glioblastoma-moderate mouse. d: Control mouse. e: Time courses of normalized 17O signal changes in representative pixels indicated in (a–d). Tumor pixels are indicated by asterisks in (a–c) and their time courses are shown as dotted lines. Brain pixels are indicated by dots in (b–d) and their time courses are shown as solid lines. GBM-L = glioblastoma-large; GBM-M = glioblastoma-moderate.
