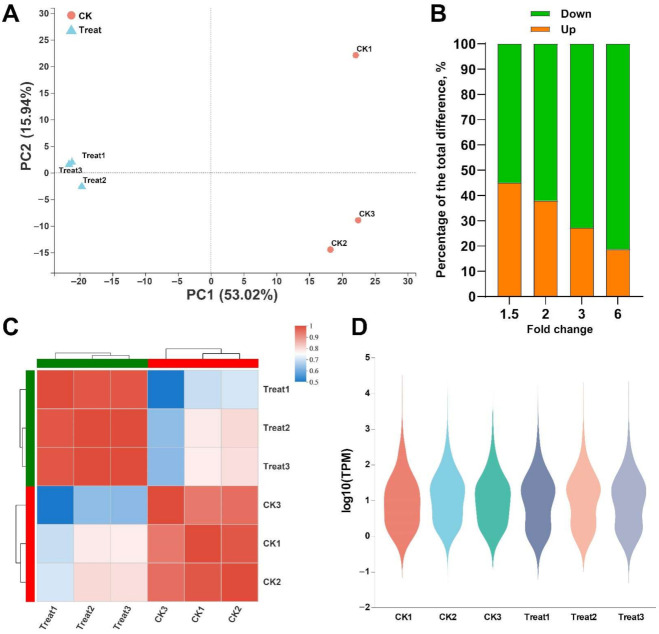
Figure 4.
Analysis of the relationship between samples. (A) PCA analysis between samples; (B) Percentage of up-regulated/down-regulated unigenes identified by different multiples of difference; (C) Heat map of correlation analysis between samples; (D) Distribution of expression levels. CK is the control group, and Treat is the thymol treatment group.

