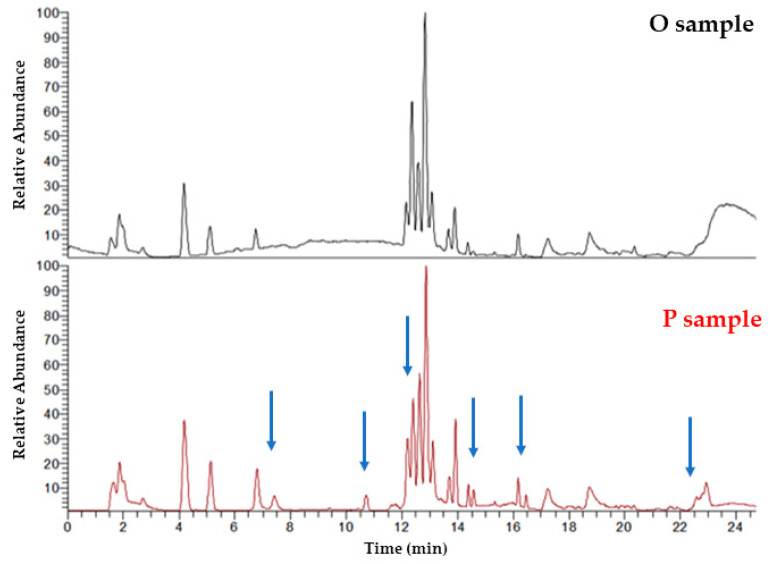
Figure 1.
Representative BPI UHPLC-(+)ESI-HRMS serum chromatograms from individual B in the first week of administration (top) in juxtaposition with the second week of administration (placebo administration) (below). Differences can be observed (blue arrows) by visual inspection and offer complementary information regarding the metabolite profiles.

