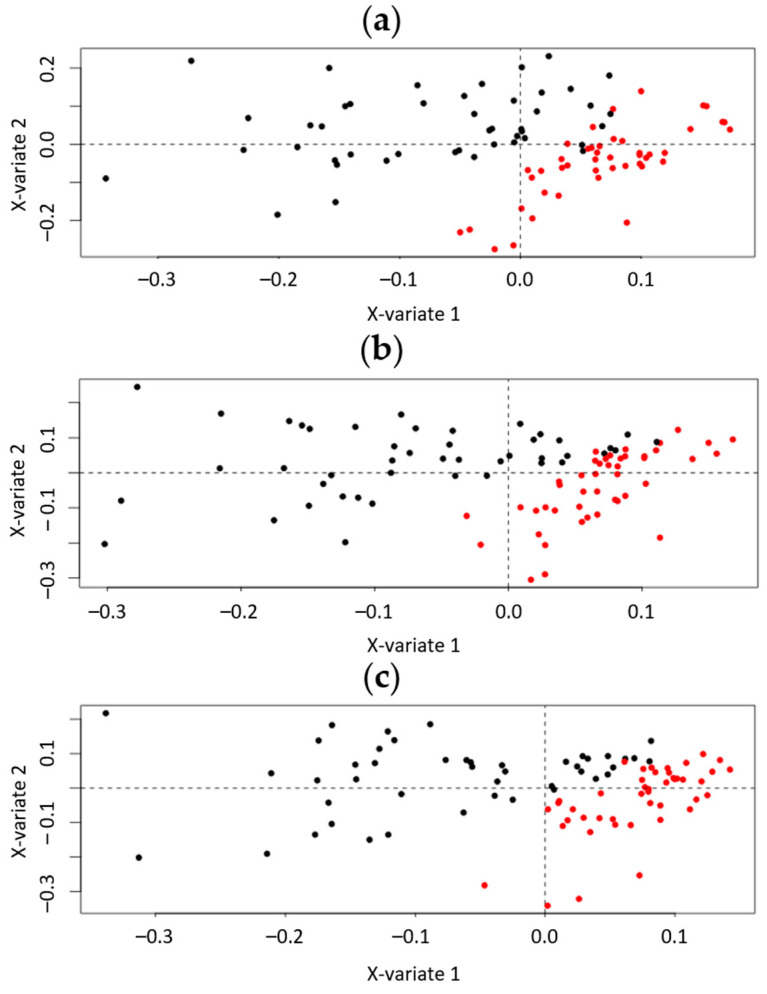
Figure 2.
One-level ML-sPLS-DA analysis of the P and O urine samples from all the days of administration, obtained by UHPLC-(+)ESI-HRMS. The multilevel PLS-DA scores plot (X-variate 1, X-variate 2) the administration effect of Varwithin according to the (a) biological variation (Varbetween) (b) week-based effect (Varweek) and (c) day-based effect (Varday). Red circles represent the P samples. Black circles represent the O samples. Clear clustering mainly due to the first component, between the P and O samples, is shown.

