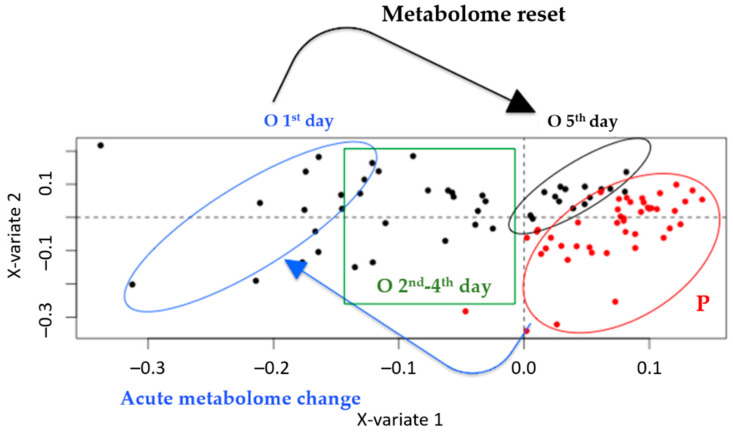
Figure 3.
Annotated version of Figure 2c showing one-level ML-PLS-DA analysis of the P and O urine samples from all the days of administration, obtained by UHPLC-(+)ESI-HRMS. Red circles represent the P samples. Black circle represents the O samples from the fifth day of administration. Blue circle represents the O samples from the first day of administration. Green box represents O samples from the second to fourth days of administration. An acute metabolome change between P and O on the first day is evident (blue arrow), whereas a gradual metabolome reset can be observed (black arrow).

