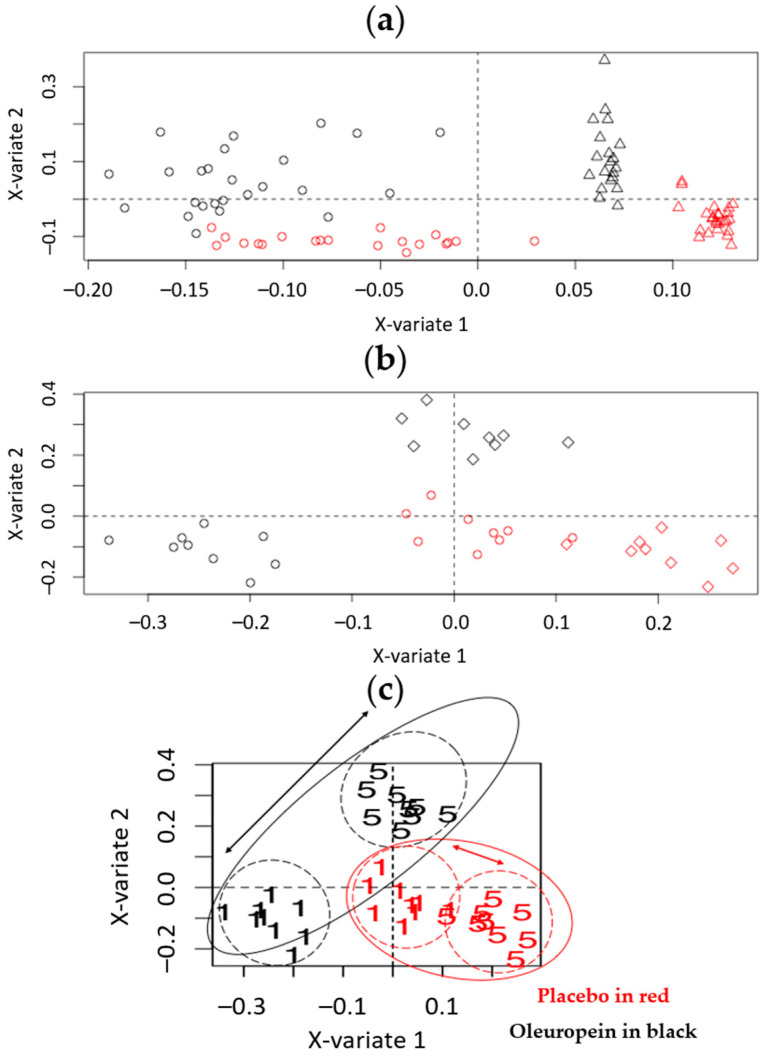
Figure 5.
Two-level ML-PLS-DA analysis of the P and O urine samples analyzed by UHPLC-(+)ESI-HRMS (a) from all the days of administration (combination of the within-subject variation and the week-based effect (Varwithin + Varweek) as the discriminant values, with the day-based effect (Varday) subtracted; (b) from the two extremes of the administration days, i.e., the first vs. the last (fifth) (the combination of the within-subject variation and the day-based effect (Varwithin + Varday) with the biological variation (Varbetween) subtracted). Then, (c) is an annotated version of panel (b). In all cases, black represents the O samples and red the P samples. In panel (a), circles represent the samples from the first week of administration and triangles represent the samples from the second week of administration. A clear clustering between the first and the second week due to the first component, and between the P and O samples due to the second component, is shown. In panel (b), circles represent the samples from the first day of administration and diamonds represent the samples from the fifth day of administration. Clear clustering between the first and the fifth days and between the P and O samples is shown. In Panel (c), “1” stands for the first day and “5” the fifth day. The distance between the first- and fifth-day metabolomes is larger for the O samples, which shows the effect of OE administration. Furthermore, O samples from the fifth day merge with the P samples in a common cluster—a metabolome reset effect.

