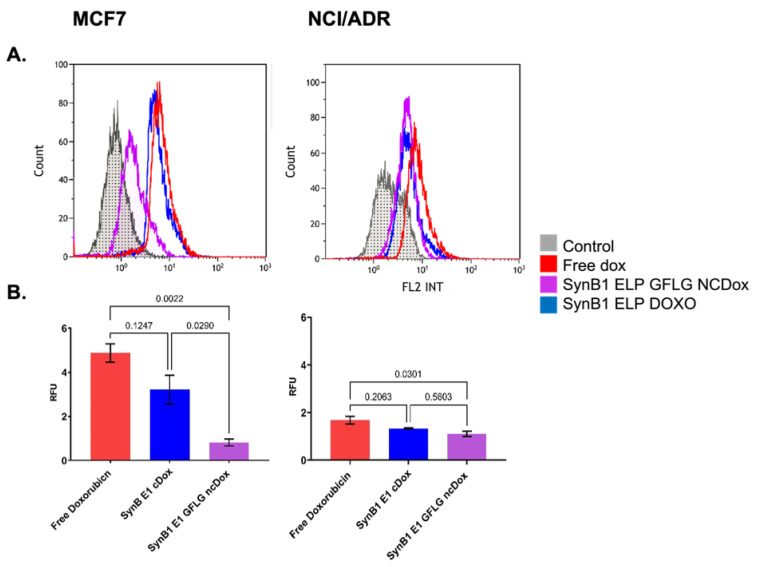
Figure 4.
Cellular uptake of dox; all treatments at 2 µM dox equivalents for 24 h. (A) Representative histograms of doxorubicin uptake in MCF-7 and NCI/ADR cell lines are shown. X-axis shows fluorescence intensity at 575 ± 30 nm. Auto-fluorescence from untreated control cells depicted in gray. (B) Amount of total fluorescence contributed by dox. Data represent mean ± S.E.M. of at least three independent experiments.

