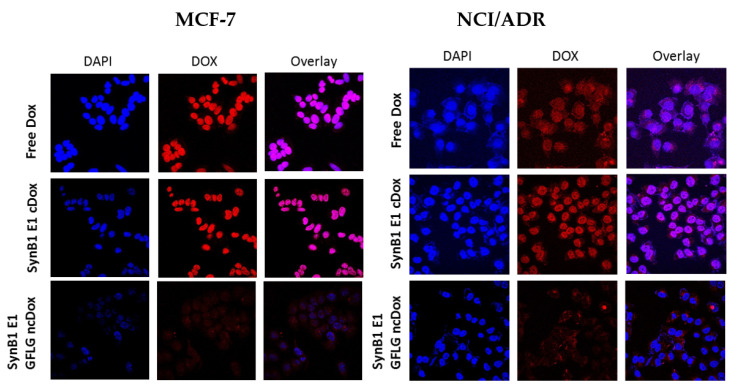
Figure 6.
Confocal microscopy analysis of subcellular drug localization, all treatments at 25 µM dox equivalents for 2 h. Representative images of MCF-7 and NCI/ADR cells stained with DAPI (blue) to reveal nuclei. Doxorubicin fluorescence (red) shows intracellular localization of free dox, SynB1-ELP-DOXO, and SynB1-E1-GFLG-ncDox, and overlay (purple) represents the regions where doxorubicin has entered the nucleus. Images are qualitative only.

