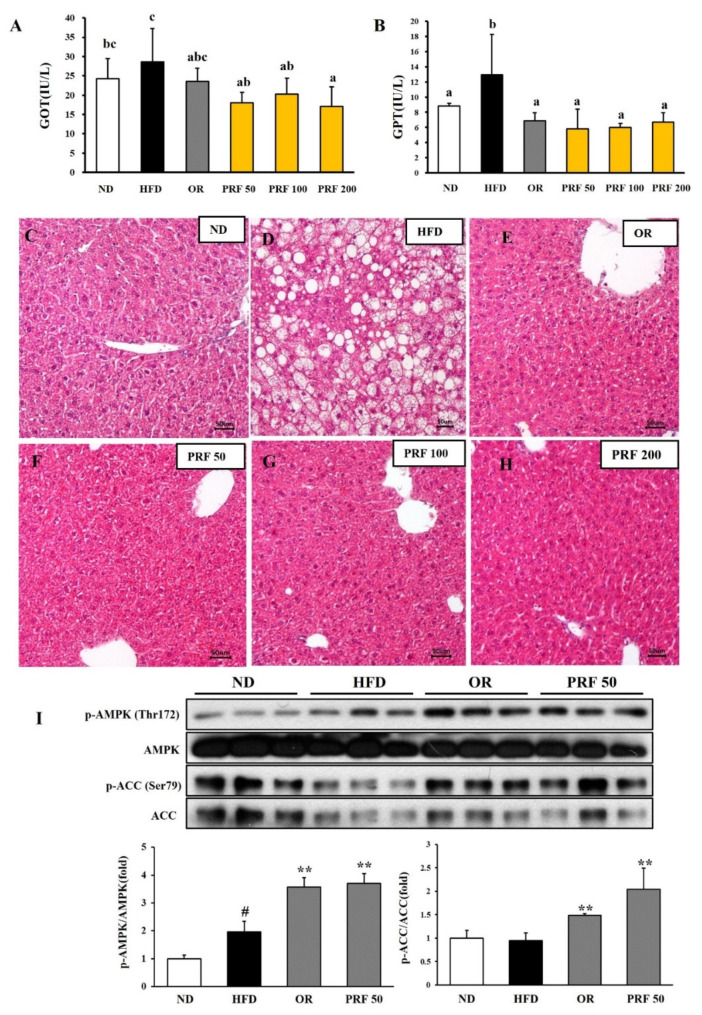
Figure 6.
Effect of PRF on liver function in HFD-induced obese mice. (A) GOT levels; (B) GPT levels. The results are expressed as the means ± SDs (n = 7). The values with different letters (a–c) are significantly different (p < 0.05) from each other according to one-way ANOVA and Duncan’s multiple-range test. The liver sections for ND (C), HFD (D), OR (E), PRF 50 (F), PRF 100 (G), and PRF 200 (H) stained with H&E (200×). Scale bar = 50 µm. (I) Western blot of AMPK and ACC. The results are expressed as the means ± SDs (n = 3; # p < 0.05 compared to ND; ** p < 0.01 compared to HFD). ND, normal diet; HFD, high-fat diet; OR, HFD + 15.6 mg of orlistat; PRF 50, PRF 100, and PRF 200, HFD + 50, 100, and 200 mg of PRF, respectively.

