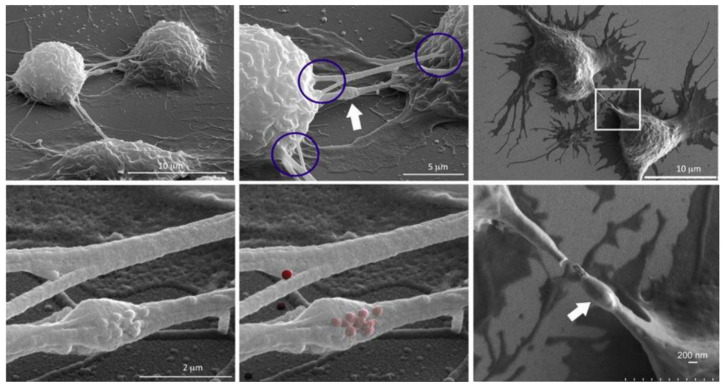
Figure 2.
SEM images showing TNTs between macrophages emphasizing disparate sites of connectivity (circled) and the presence of a gondola (white arrow). NMeds are pseudo-colored red in the lower central image. Reproduced with permission from Franco et al. [137] (Cancers; published by MDPI; 2020).

