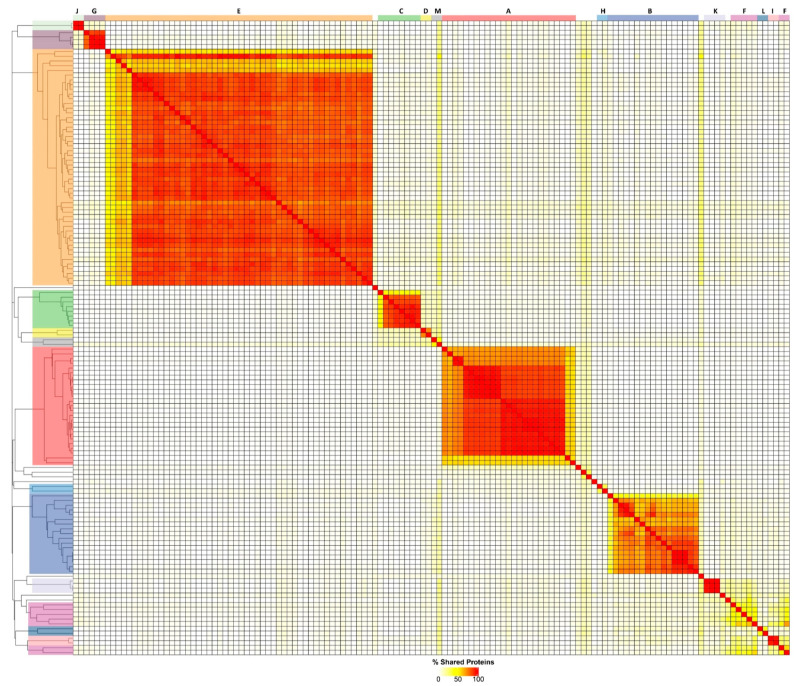
Figure 1.
Heatmap of the percentage of proteins shared between pairs of Acinetobacter phage genomes. The heatmap was produced from the output of the PIRATE pan-genome analysis and hierarchically clustered using the complete linkage method in R. Clusters are indicated by coloured blocks at the top of the heatmap and within the dendrogram according to the key:  A;
A;  B;
B;  C;
C;  D;
D;  E;
E;  F;
F;  G;
G;  H;
H;  I;
I;  J;
J;  K;
K;  L;
L;  M.
M.

