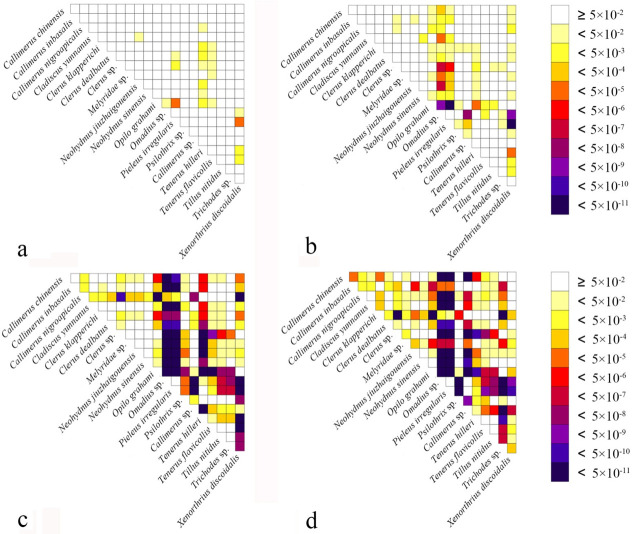
Figure 1.
Heterogeneous sequence divergence of mitochondrial genomes of Cleridae resulting from pairwise comparison of four aligned datasets: (a) PCG12rRNA; (b) PCG; (c) PCGrRNA; (d) PCGRNA. The dark colors indicate the higher randomized accordance, whereas the lighter colors indicate the opposite. All taxa names are listed to the right of the heat map. Although cells specify p-values > 0.05, indicating that corresponding pairs of nucleotide sequences do not violate the assumption of global stationery and homogeneity conditions.

