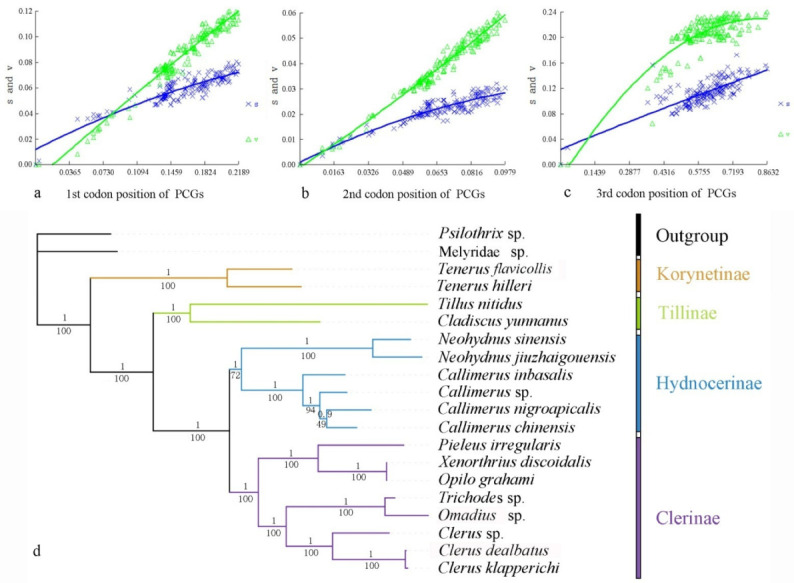
Figure 2.

Nucleotide substitution saturation plots of all mitochondrial protein-coding genes: (a) 1st codon positions; (b) second codon positions; (c) third codon positions. Plots in blue and green indicate transition and transversion, respectively; (d) phylogenetic tree of Cleridae inferred from the BI and ML analyses of the PCG12RNAdataset. Numbers at the branches determine posterior probability (upper) or bootstrap value (lower).
