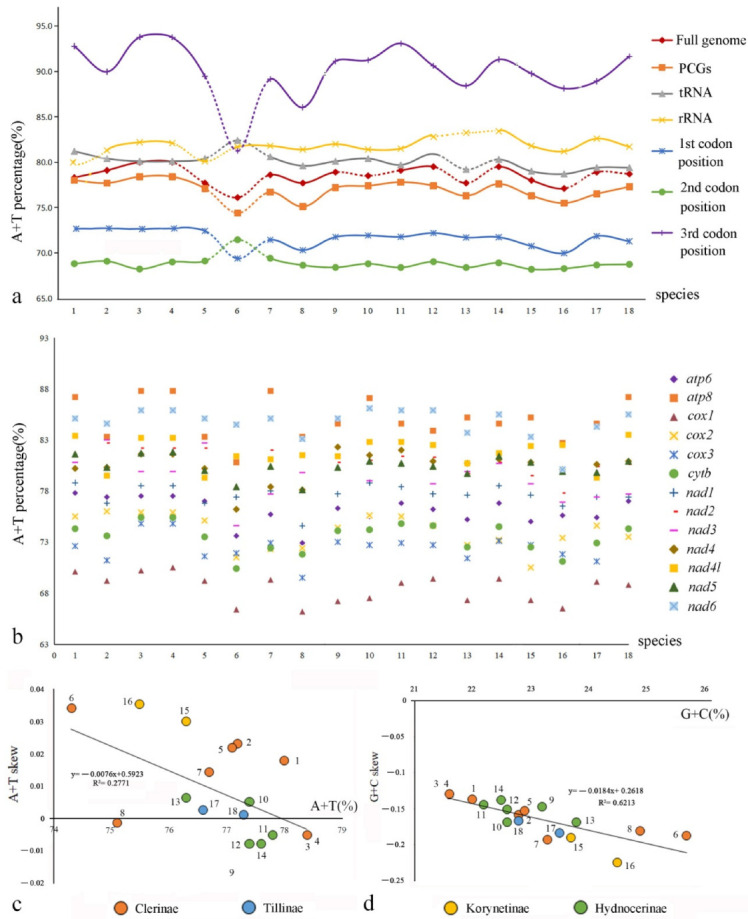
Figure 4.

Comparison of nucleotide compositions of mitochondrial genomes among four subfamilies of Cleridae: (a) A+T% of different components or positions; (b) A+T% of different PCGs; (c) the correlations between A+T% and AT skew in the 13 PCGs; (d) the correlations between G+C% and GC skew in the 13 PCGs.
