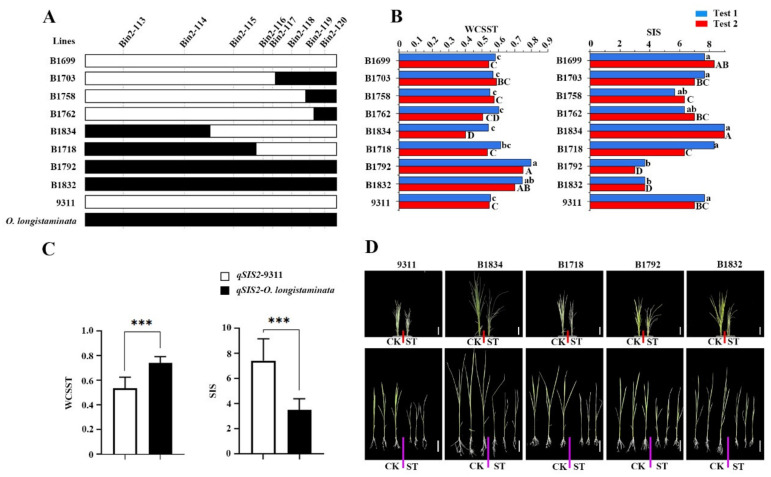
Figure 4.
Validation of the function of qWCSST2/qSIS2/qRWCS2. (A) Genotype of the representative BIL lines. (B) Phenotypic value corresponding to BILs. (C) Average of the WCSST and SIS value of the representative BIL lines with and without qWCSST2/qSIS2/qRWCS2. The white rectangle shows the homozygous genotype from parent 9311, including BIL 1699, 1703, 1758, B1762, 1834, 1718. The black rectangle indicates the heterozygote genotype, and contains BIL 1792 and 1832. *** p < 0.001. (D) The phenotype of the representative BILs and the parent 9311, bar = 5 cm. The red and purple lines separate control and salt-treated seedlings, with the control seedlings on the left and the salt-treated seedlings on the right.

