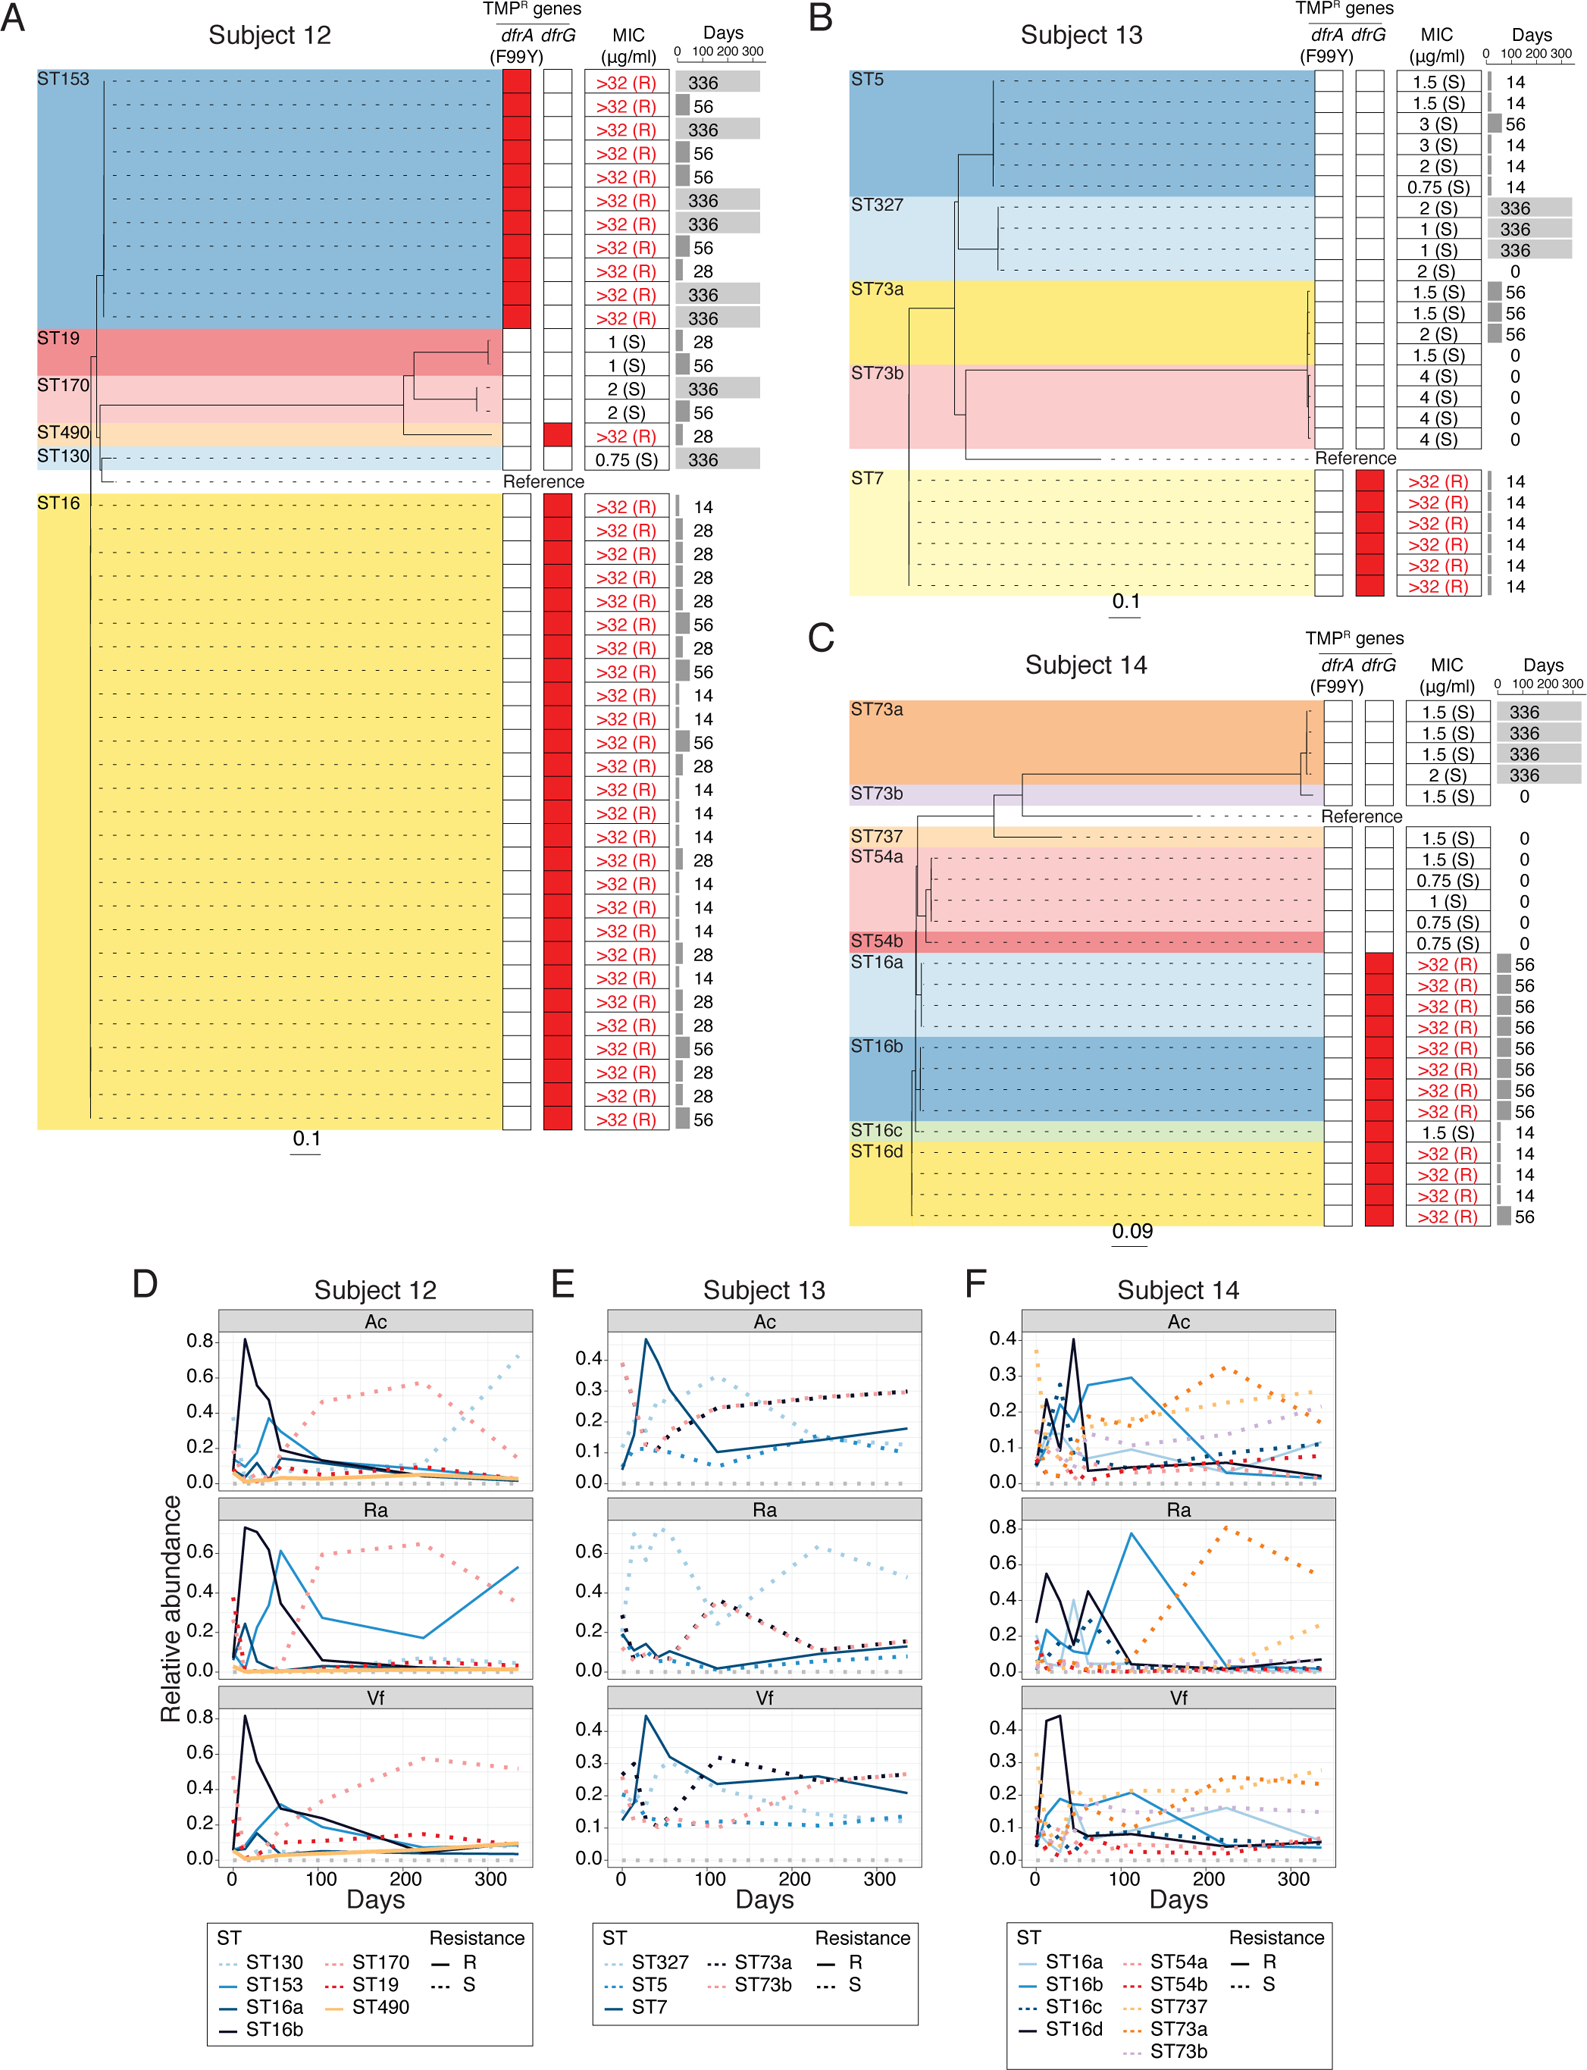
Fig. 4. Dynamics of S. epidermidis strains in TMP/SMX group.

(A) to (C) Phylogeny of S. epidermidis isolates from Subject 12 (A), 13 (B) and 14 (C). Dashed lines connect with TMP-resistant genes profiles (heatmap), with red denoting presence of specific resistant genes. Minimum inhibitory concentration (MIC) for TMP is summarized on the middle column. Time point (days) of isolation for each isolates are indicated on the right pane l. (D) to (F) Changes of relative abundances of S. epidermidis STs from metagenomic data of TMP/SMX subjects. Subject 12 (D), 13 (E) and 14 (F). Relative abundances of each ST were estimated by BIB (see Methods for detail).
