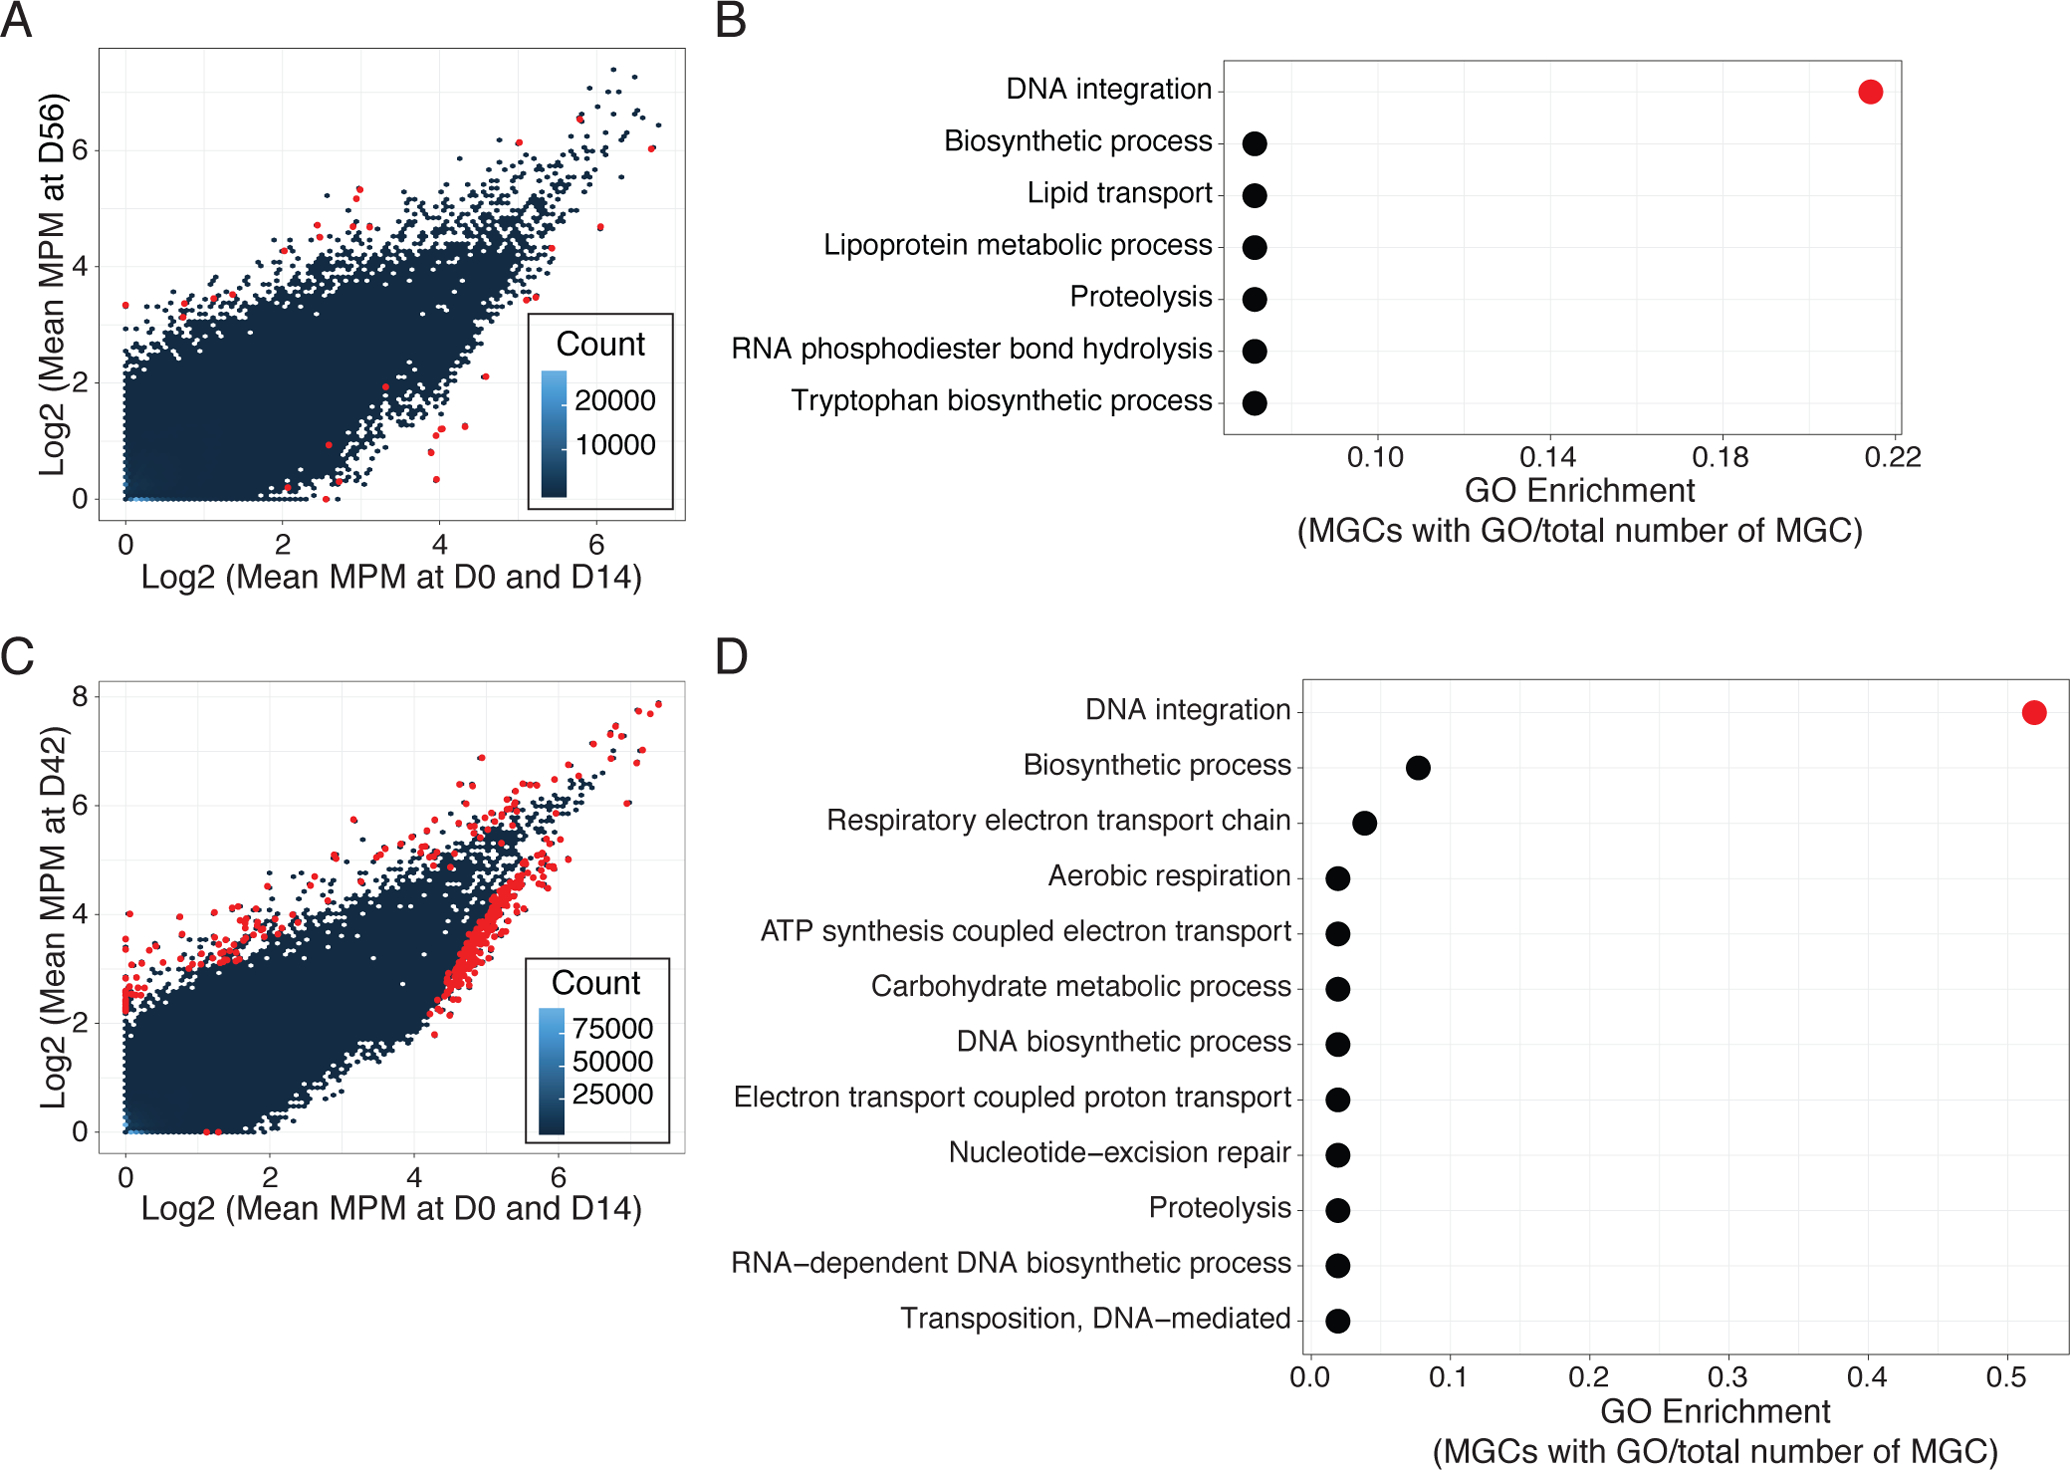
Fig. 5. Increased gene mobilization of skin microbiomes with antibiotic use.

(A) and (C) Comparison of MGC relative abundances between D0 and D56 in Doxy100 subjects (A) and D0 and D42 in TMP/SMX subjects (C). The x-axis indicates log-transformed mean MGC abundances (MGC abundance per million reads (MPM), see Methods for detail) at D0 and D14 and the y-axis indicates log-transformed mean MPM at D56 (A) and D42 (C). Hexbin (blue to dark blue colors) indicate the number of MGCs in each hexagon and red points indicate significantly increased or decreased MGCs (adjusted P<0.05). (B) and (D) Analysis for Gene Ontology (GO, biological process) enrichment of increased MGCs in Doxy100 subjects (B) and in TMP/SMX subjects (D). GO enrichment was calculated by dividing of MGC with indicated GO term to the all differentially abundant MGC (x-axis). Red color indicates P<0.05 (Fisher’s exact test, see Methods).
