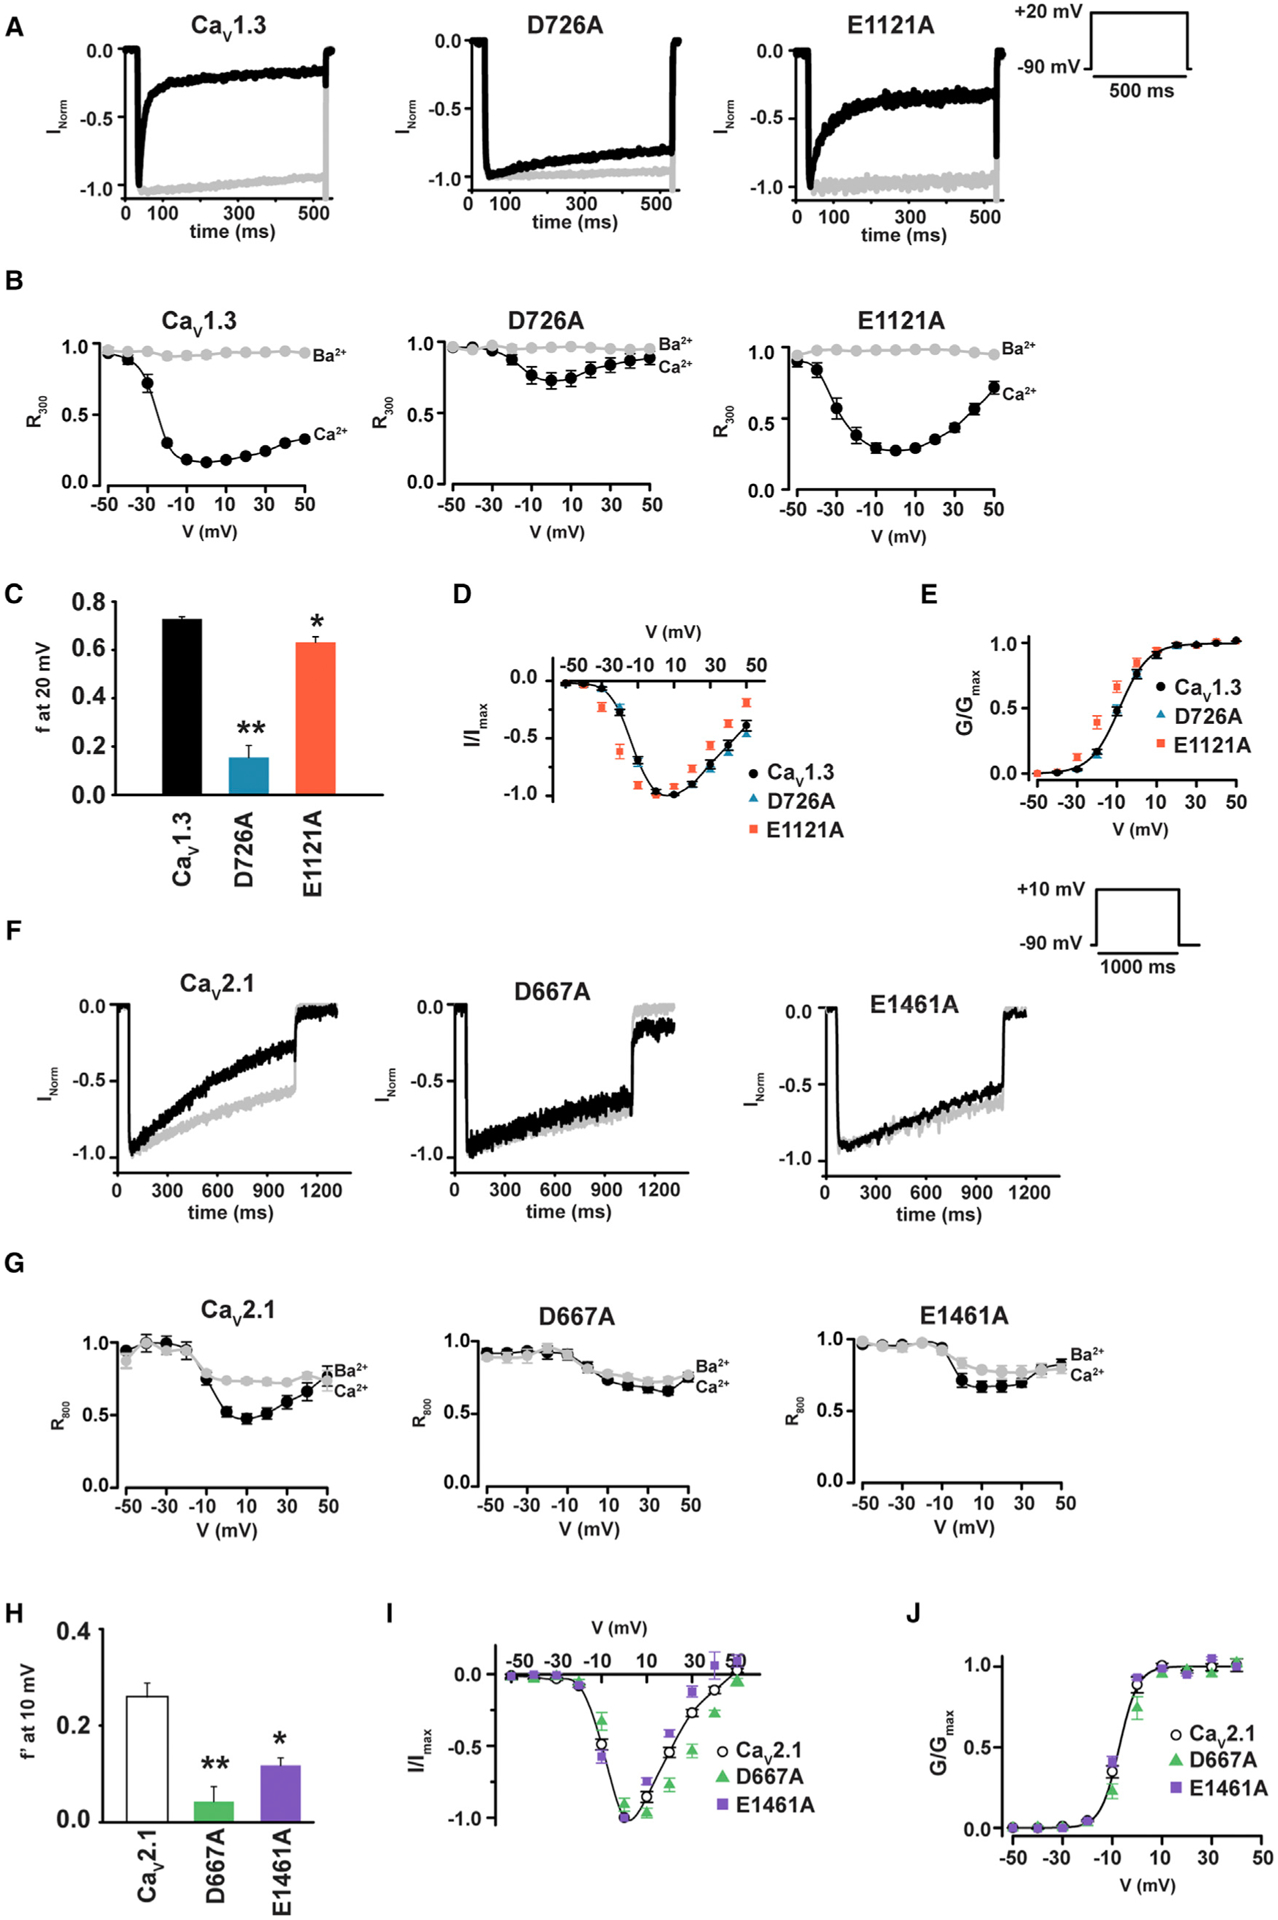
Figure 4. Domain II SF Mutations Reduce CDI in CaV1.3 and CaV2.1.

(A) Exemplar normalized recordings at +20 mV in Ca2+ (black) or Ba2+ (gray) from HEK293 cells expressing CaV1.3 or the indicated mutants.
(B) Fractional current remaining 300 ms post-depolarization (R300) as a function of the membrane potential for (A).
(C) Average f values at +20 mV. *p < 0.01 and **p < 0.001 compared to CaV1.3.
(D) I–V relationships for CaV1.3 (black circles), CaV1.3 D707A (blue triangles), and CaV1.3 E1121A (red orange squares).
(E) Voltage-dependent activation curves for the indicated channels. Symbols are as in (D).
(F) Exemplar normalized recordings at +10 mV in Ca2+ (black) or Ba2+ (gray) from HEK293 cells expressing CaV2.1 or the indicated mutants.
(G) Fractional current remaining 800 ms post-depolarization (R800) as a function of the membrane potential for (F).
(H) Average f′ values at +10 mV, where is f′ the difference between Ca2+ and Ba2+ R800 values. *p < 0.01 and **p < 0.001 compared to CaV2.1.
(I) I–V relationships for CaV2.1 (open circles), CaV2.1 D667A (green triangles), and CaV2.1 E1461A (purple squares).
(J) Voltage-dependent activation curves for the indicated channels. Symbols are as in (I).
