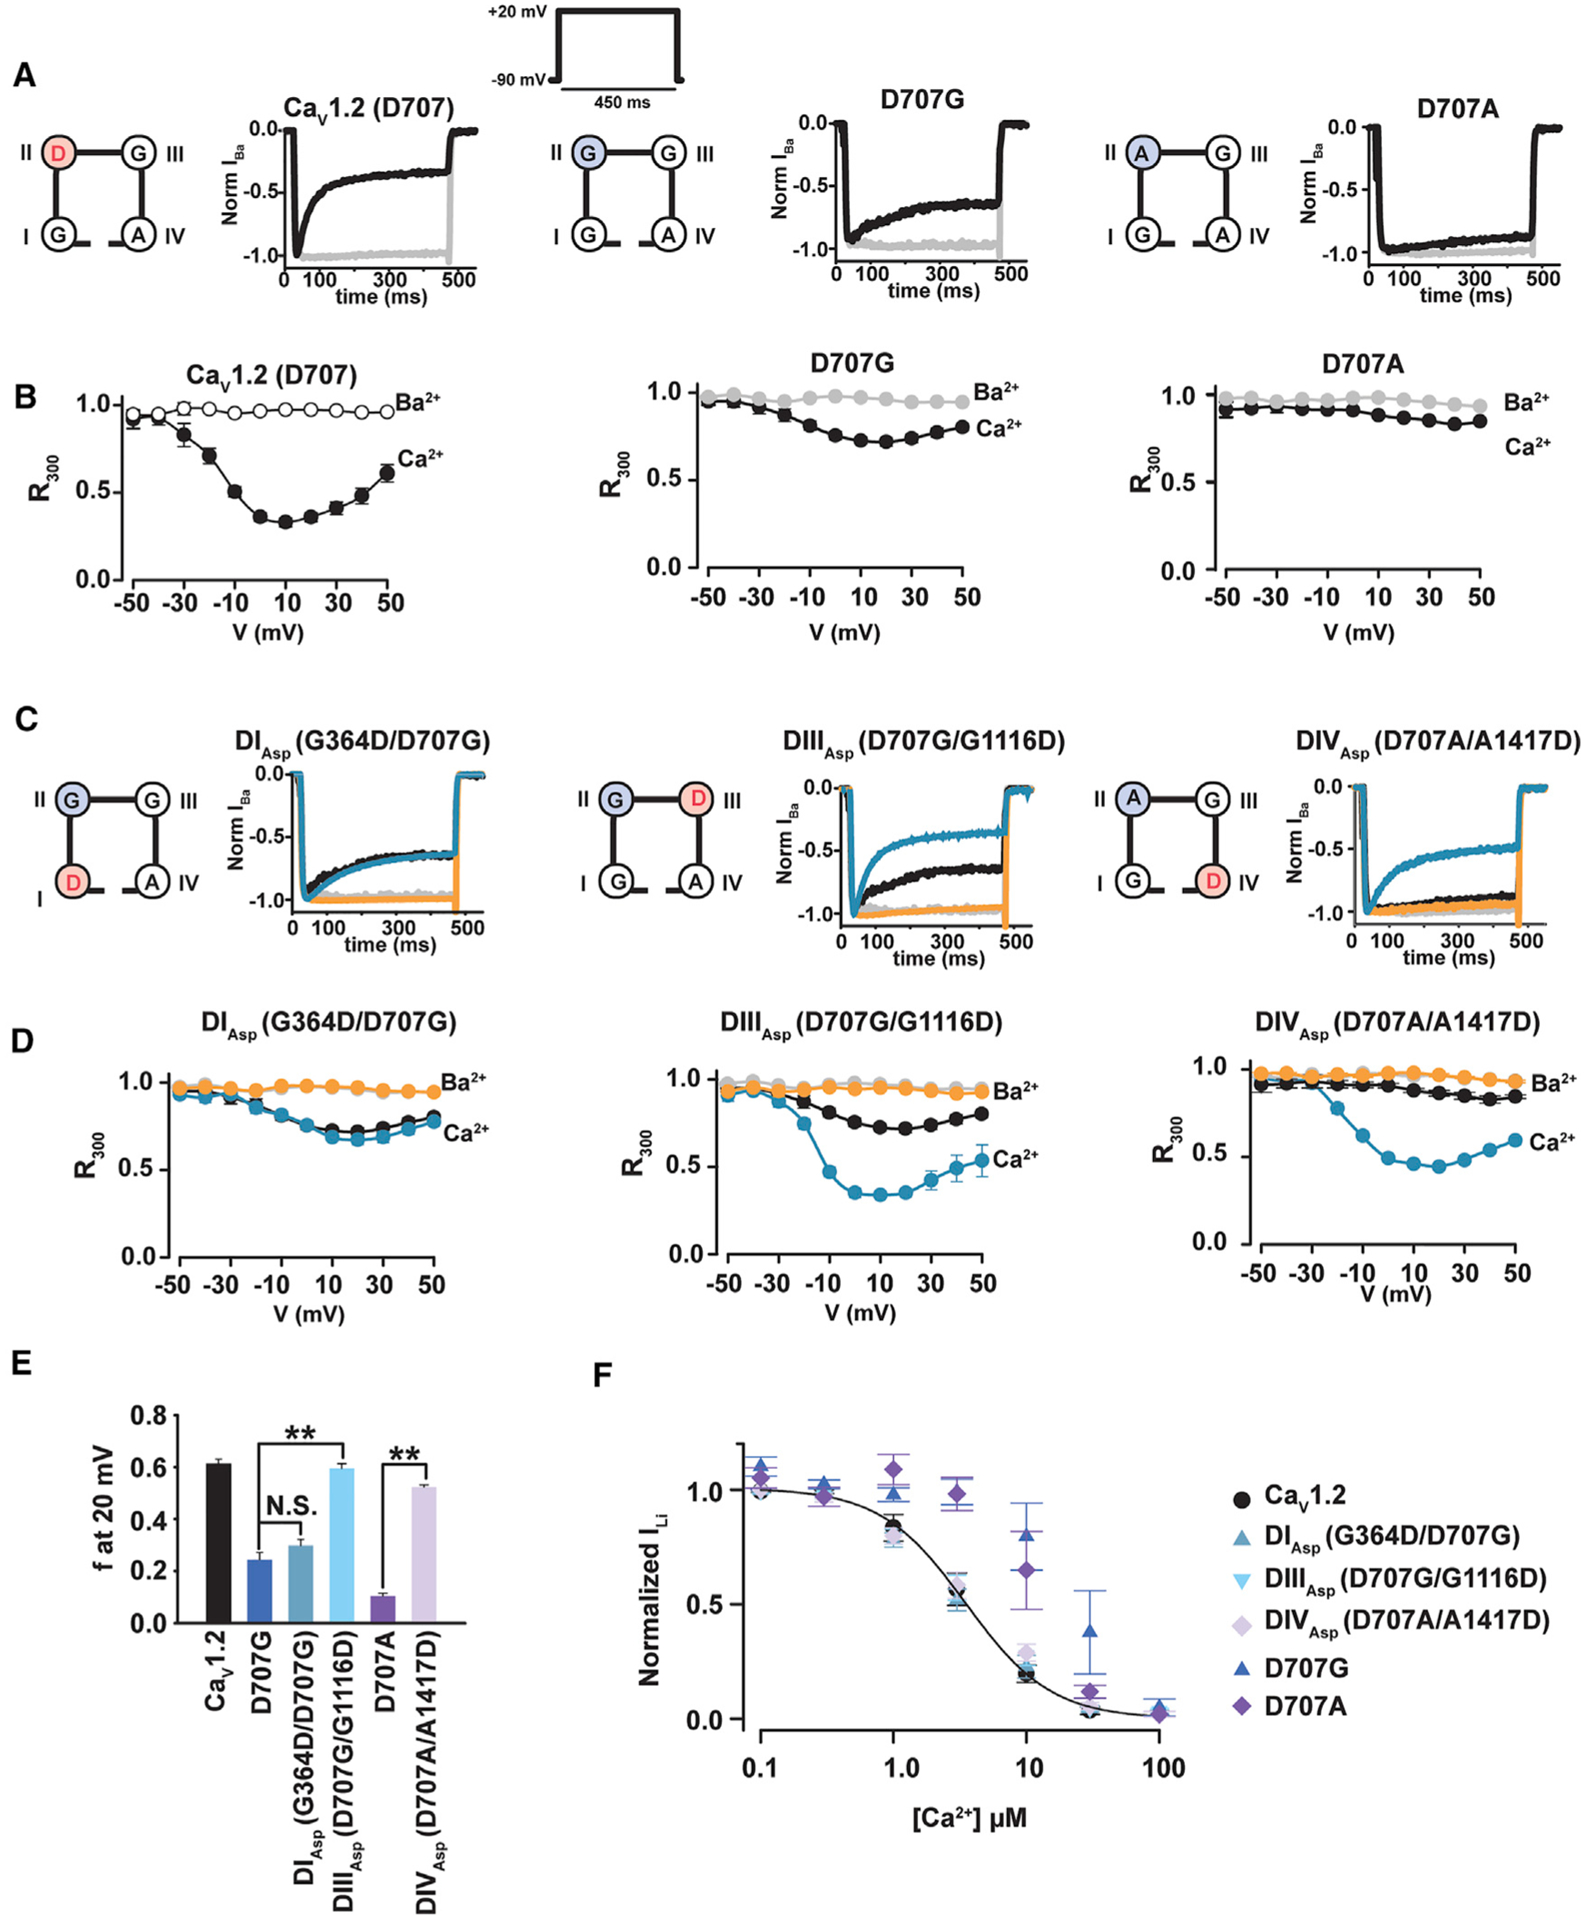
Figure 5. CaV1.2 CDI Requires a Negative Charge at the DII, DIII, or DIV SF (+1) Position.

(A) Exemplar normalized recordings at +20 mV in Ca2+ (black) or Ba2+ (gray) from Xenopus oocytes expressing the CaV1.2 or the indicated mutants.
(B) Fractional current remaining 300 ms post-depolarization (R300) as a function of the membrane potential for channels in (A). Data in (A) and (B) are identical to Figures 1A and 1B.
(C) Exemplar normalized recordings at +20 mV in Ca2+ (blue) or Ba2+ (orange) from Xenopus oocytes expressing the indicated CaV1.2 mutants moving the negative charge at the (+1) position of the selectivity filter from domain II to domains I, III, or IV. Ca2+ (black) and Ba2+ (gray) currents from CaV1.2 are shown for comparison.
(D) Fractional current remaining 300 ms post-depolarization (R300) as a function of the membrane potential for channels in (C).
(E) Average f values at 20 mV. **p < 0.001 compared to the corresponding single mutant.
(F) Dose-response curves for Ca2+ block of Li+ currents for CaV1.2, DIAsp G364D/D707G (blue triangles), DIIIAsp D707G/G1116D (inverted blue triangles), and DIVAsp D707A/A1417D (lavender diamonds). Each data point at each Ca2+ concentration is normalized to the current at 3 nM Ca2+ and averaged for n = 7–9 oocytes.
