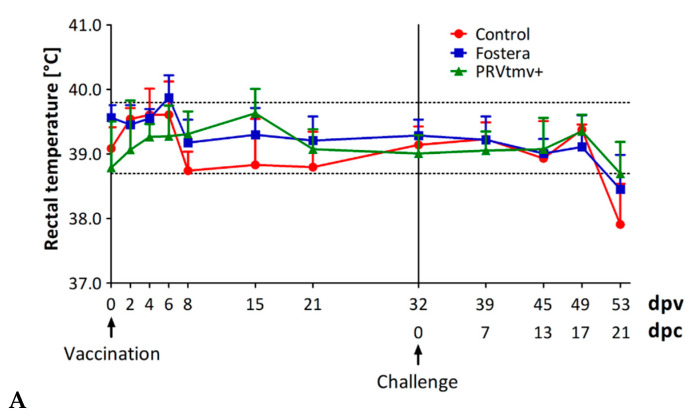
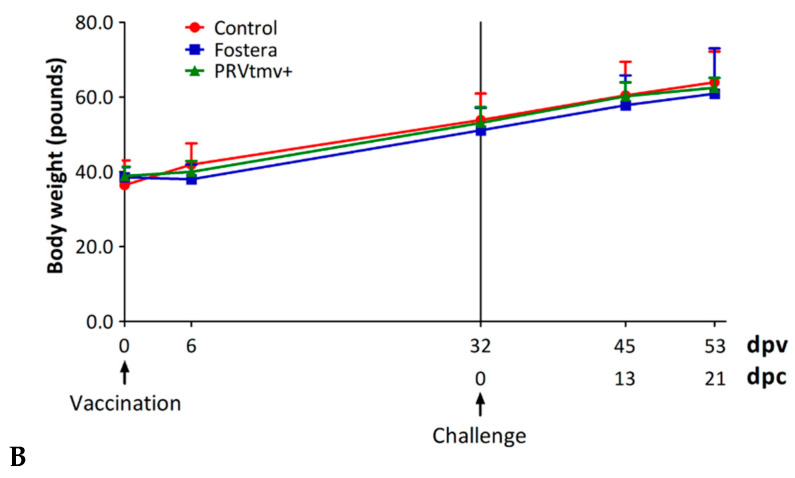
Figure 8.
Clinical assessment. (A) Rectal temperature of pigs following immunization and challenge. Rectal temperature was measured using a digital thermometer on indicated days. Shown is the mean temperature of each treatment group with standard deviation (SD) (n = 5). (B) Body weight (BW) of pigs following immunization and challenge. BW was measured using a digital weight balance on indicated days. The mean BW of each treatment group with SD (n = 5) is shown. dpv—days post-vaccination; dpc—days post-challenge. Two-way ANOVA followed by Bonferroni post-tests to compare replicate means by row. p < 0.05 is considered as significant.


