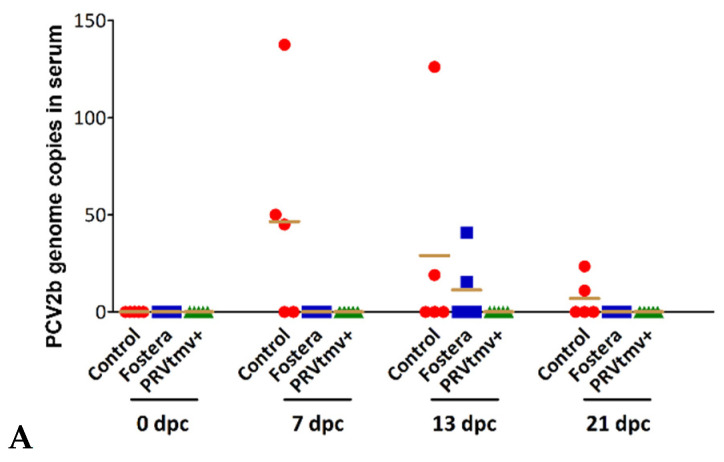
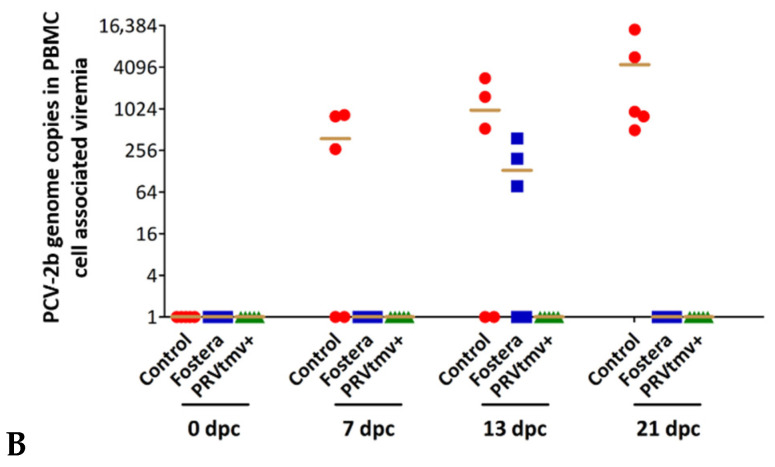
Figure 16.
PCV2b in serum (cell-free) and PBMC (cell-associated viremia) in control and vaccinated pigs following the challenge was assessed by qPCR. DNA was isolated from serum and PBMC, and PCV2b qPCR was performed as described. PCV2b genome copy numbers were calculated according to CT-values of a standard curve. (A) Shown is the mean copy numbers of PCV2b genome in serum (100 ng of DNA) and (B) PBMC (normalized to 107 cells) of two independent qPCR analysis of each animal from three vaccination group on 0, 13, 17, and 21 dpc. The dot plot graph represents mean + individual values in each group (n = 5). dpc—days post-challenge.


