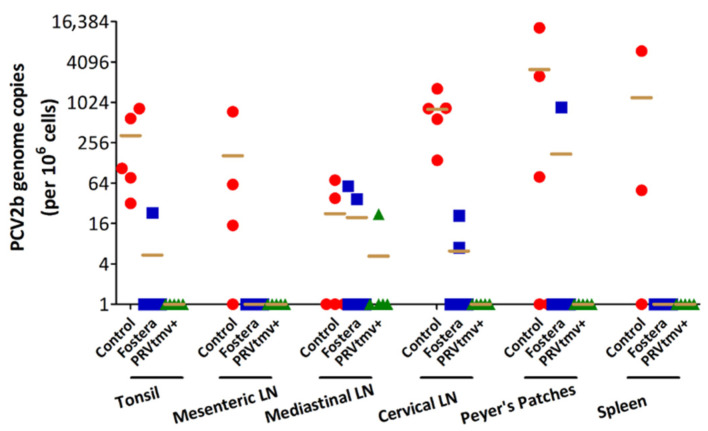
Figure 18.
Quantification of PCV2b viral genome copies in pig tissues. DNA was isolated from 25 mg of tissues (tonsil, mesenteric LN, mediastinal LN, cervical LN, Peyer’s patch, and spleen), and PCV2b qPCR was performed. PCV2b genome copy numbers were calculated according to CT-values of a standard curve. Calculated PCV2b genome copies were normalized based on porcine house-keeping gene GAPDH, and shown are the mean copy numbers of PCV2b genome per one million cells. Two independent qPCR analyses were performed for each animal from three vaccination groups. The dot plot graph represents the mean + individual values in each group (n = 5).

