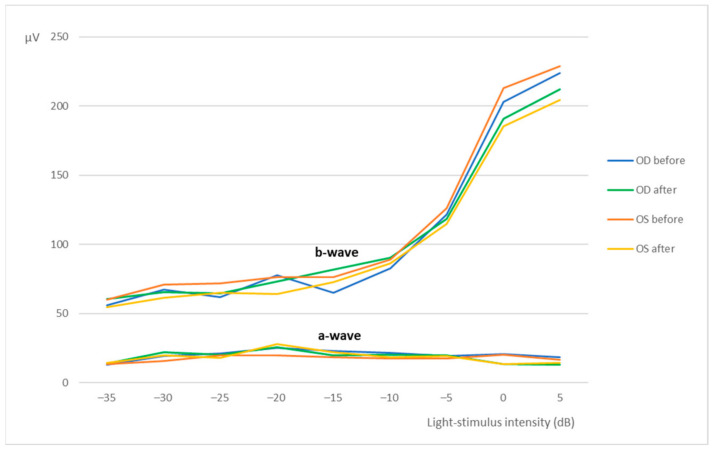
Figure 4.
Photopic luminesce response-mean amplitudes of the a-wave and the b-wave (µV) recorded from the OD and OS in response to increscent light-stimulus intensities (dB). Values correspond to before and after the administration of the nanoparticles (after–before euthanasia). Data represent all groups.

