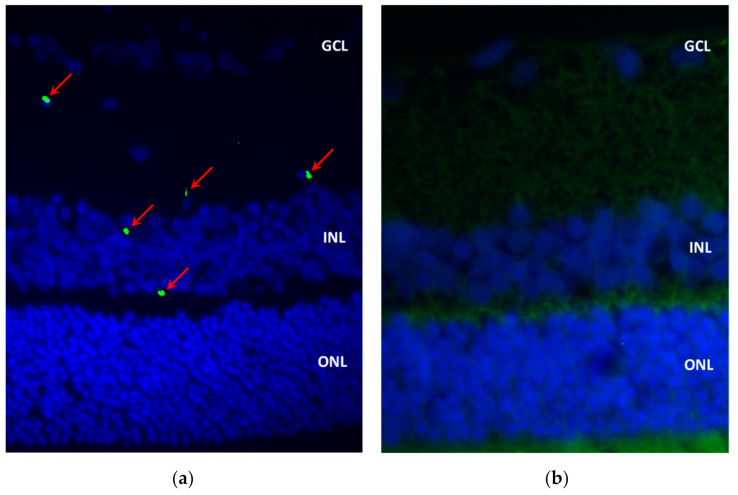
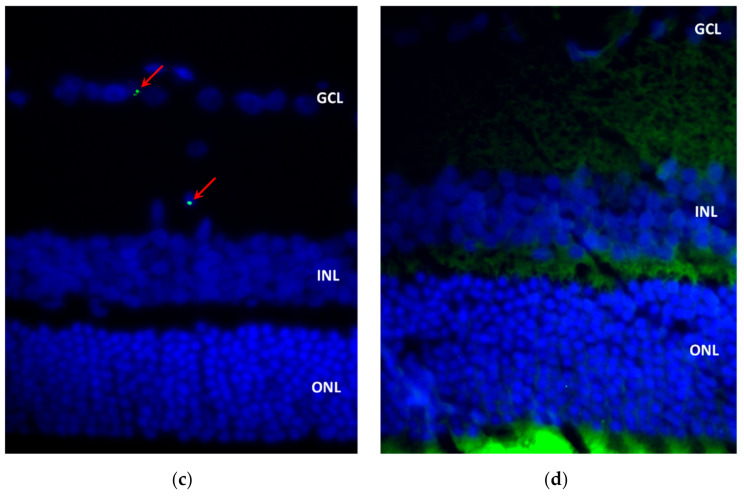
Figure 8.
Immunofluorescence image showing a cross-section of the retina after CS/HA-EPOβ administration: (a) OD from group A; (b) OS from group A (control); (c) OD from group F; (d) OS from group F (control). Green and blue channels were merged, and green tissue auto-fluorescence is visible in (b,d). Red arrows indicate EPOβ and cell nuclei are blue (DAPI) (40). GCL, ganglion cell layer; INL, inner nuclear layer; ONL, outer nuclear layer.


