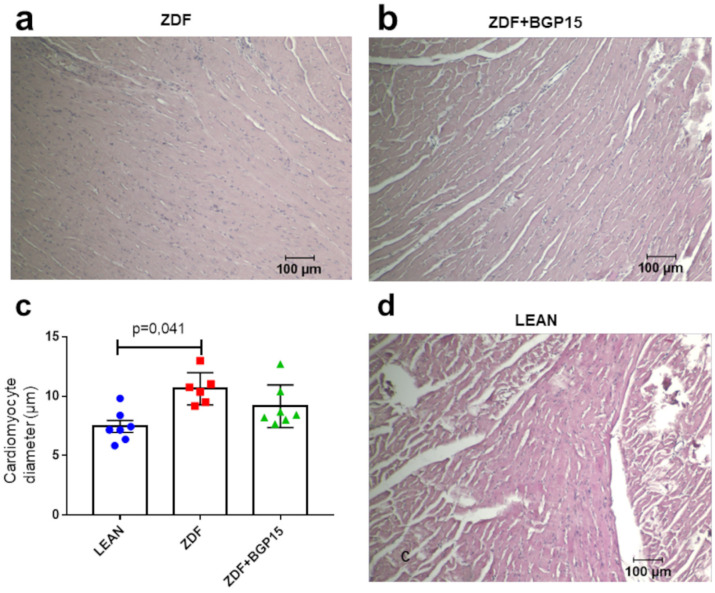
Figure 2.
Histological samples stained with haematoxylin and eosin and their quantification. (a) Histological sample from the diseased group (ZDF), (b) histological sample from the BGP-15-treated ZDF group, (c) cardiomyocyte diameters among groups. All data are presented as mean ± standard deviation (SD, (d) histological sample from the control (LEAN) group, and). p < 0.05. Statistical analysis was carried out by GraphPad Prism 7.00: D’Agostino and Pearson normality test was used to estimate Gaussian distribution, and then data were analysed with ordinary one-way ANOVA or Kruskal–Wallis test. The groups were matched by Tukey’s multiple comparisons test.

