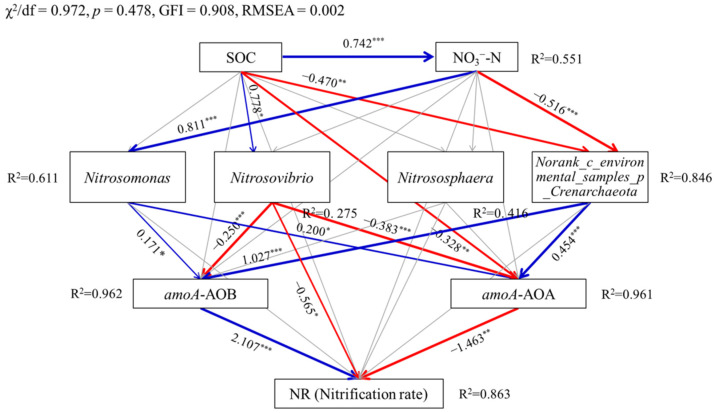
Figure 5.
Structural equation models showing the effects of soil properties (SOC and NO3−-N) induced by biochar addition, dominant taxa of ammonia-oxidizing microorganisms, and amoA gene abundance on the soil nitrification rate (NR) at the genus level. Blue and red arrow lines indicate significant positive and negative relationships, respectively. Gray arrow lines indicate nonsignificant relationships. Numbers above arrow lines are standardized path coefficients. R2 indicates the proportion of variance explained by the model. *** p < 0.001; ** p < 0.01; * p < 0.05.

