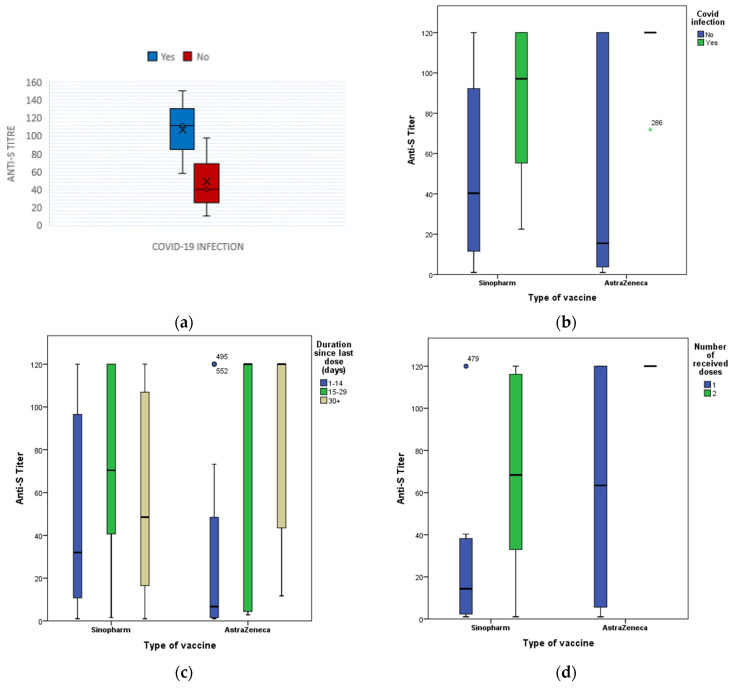
Figure 2.
Box-Plot for anti-S titers (RU/mL) quartiles among vaccinated HCWs according to (a) the history of the previous infection, (b) the vaccine type in relation to the history of previous infection (c) the vaccine type in relation to the. duration since the last dose of vaccination and (d) the vaccine type in relation to the number of received doses. × indicates the mean value of the data being plotted. * indicates an outlier is present.

