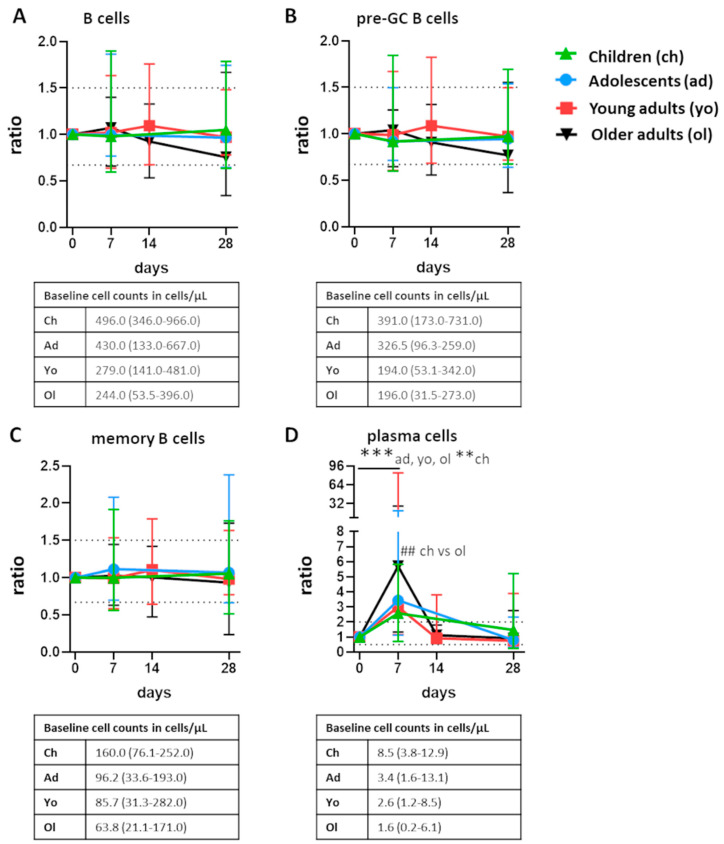
Figure 1.
Postvaccination fluctuations of major B-cell subsets. Fluctuations of (A) total B cells (B) pre-germinal center (pre-GC) B cells, (C) memory B cells, and (D) plasma cells postvaccination presented as ratio over baseline (median, min-max). For total B cells, pre-GC B cells, and memory B cells, the dashed lines indicate a ratio over baseline of 0.67 and 1.5. For plasma cells, the dashed lines indicate a ratio over baseline of 0.5 and 2.0. Underneath each graph, the baseline cell counts per cohort are presented in cells/µL (median, min-max). To assess longitudinal changes within each cohort, Wilcoxon matched pair signed-rank test followed by Bonferroni correction was used. To test differences between cohorts at one timepoint, Kruskal–Wallis followed by Dunn’s test was used, with exception of the comparison at day 14. At day 14, only blood samples from the adult cohorts were collected; here, the Mann–Whitney test followed by Bonferroni correction was used. For longitudinal changes, only significant differences compared with baseline are shown. Significant longitudinal differences within a cohort are indicated as **, p ≤ 0.01; ***, p ≤ 0.001. Significant differences between cohorts at the same time point are indicated as ##, p ≤ 0.01.

