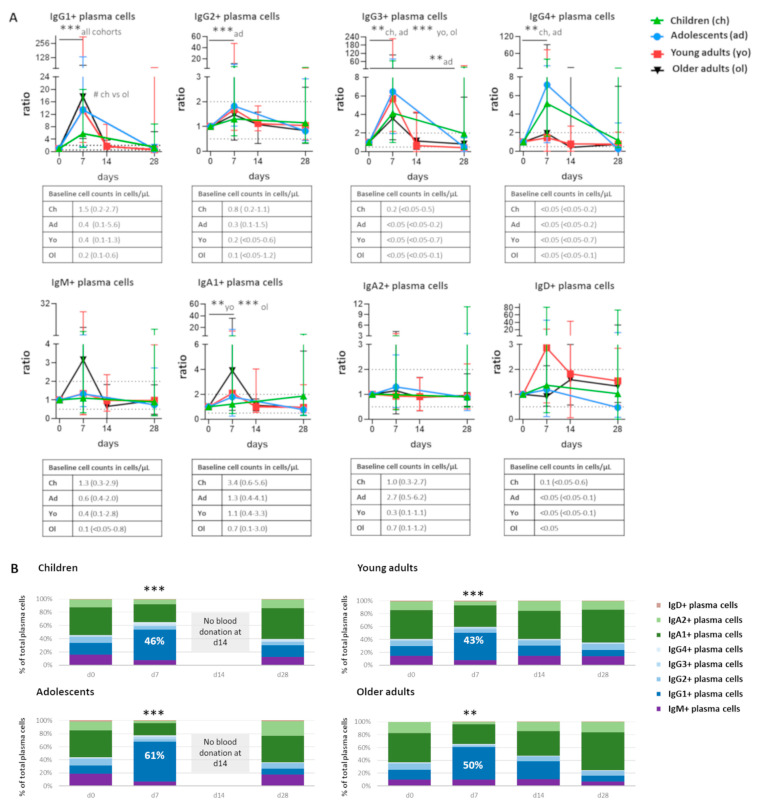
Figure 2.
Individuals of all age groups underwent expansion of IgG1+ plasma cells at day 7 postvaccination. (A) Quantitative changes in plasma cells expressing different Ig subclasses, presented as ratio over baseline (median, min-max). Each symbol represents a median value with range. Dashed lines indicate a ratio over baseline of 0.5 and 2. Underneath each graph, the baseline cell counts per cohort are presented in cells/µL (median, min-max). Wilcoxon matched pair signed-rank test followed by Bonferroni correction was used to assess longitudinal differences within each cohort. Differences in ratio at day 7 between cohorts were assessed using Kruskal–Wallis followed by Dunn’s test. (B) Over-time distribution of plasma cells expressing different Ig subclasses. Median values for each population were used to construct the plots. Wilcoxon matched pair signed-rank test followed by Bonferroni correction was used to assess longitudinal differences in the percentage of IgG1+ cells in the total plasma cell compartment within each cohort. Differences in the percentage of IgG1+ cells in total plasma cell compartment between cohorts were assessed using Kruskal–Wallis followed by Dunn’s test but did not yield significant differences. For pediatric cohorts, no blood samples were collected at day 14; the Mann–Whitney test followed by Bonferroni correction was used. For longitudinal changes, only significant differences compared with baseline are shown. Significant longitudinal differences within a cohort are indicated as **, p ≤ 0.01; ***, p ≤ 0.001. Significant differences between cohorts at the same time point are indicated as #, p < 0.05. d = days after vaccination.

