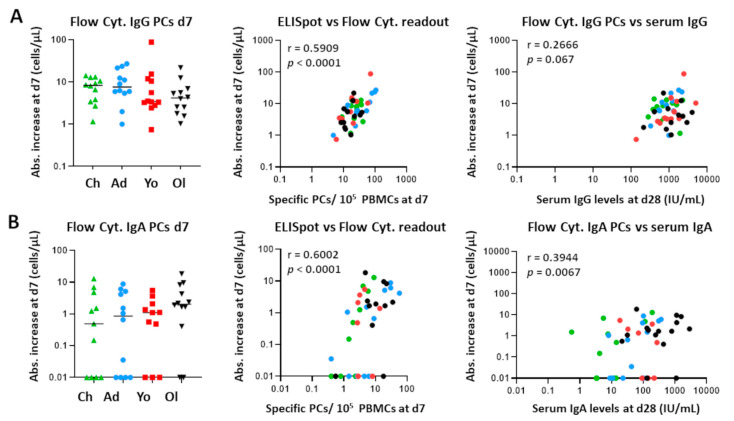
Figure 5.
Correlation between cellular changes as measured by flow cytometry and ELISpot, and the correlation between plasma cell expansion and vaccine-specific serum Igs 28 days postvaccination. (A) Left panel: expansion of IgG+ plasma cells (day 7) per individual, expressed as absolute increase in cells/μL. Middle panel: correlation between the ELISpot and flow cytometry readout for IgG+ plasma cells. Right panel: correlation between the increase in plasma cells (as measured by flow cytometry) and the vaccine-specific serum IgG levels (day 28). (B) Left panel: expansion of IgA1+ plasma cells (day 7) per individual, expressed as absolute increase in cells/μL. Middle panel: correlation between the ELISpot and flow cytometry readout for IgA+ plasma cells. Right panel: correlation between the increase in plasma cells (as measured by flow cytometry) and the vaccine-specific serum IgA levels (day 28). Each dot represents a single donor. Of note, for visualization purposes, all absolute increases lower than 0.01 were set to 0.01. The original values were used to calculate the Spearman correlations. Flow Cyt. = flow cytometry; PCs = plasma cells; d = days after vaccination; Abs. = absolute.

