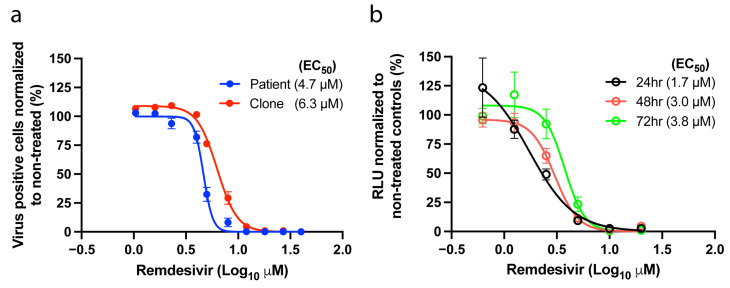
Figure 3.
Susceptibility to remdesivir. (a) Antiviral activity of remdesivir against the patient and the clone viruses (passage 2 viruses). (b) Antiviral potency of remdesivir against the nLuc reporter virus measured 24, 48, and 72 h after treatment using a luciferase assay. The graphs show the non-linear regression curve of the number of SARS-CoV-2 infected cells treated with different remdesivir concentrations normalized to non-treated controls. The dots and circles represent the mean of triplicates; error bars represent standard error of the mean. For some data points the differences are too small to plot error bars. EC50 values (µM) inferred from the regression are shown in parenthesis.

